Business intelligence (BI) services like Power BI often struggle with such challenges as messy data formats, gaps in information, and tedious manual processes. Setting up effective ETL processes helps you to turn chaotic data into clear, transparent insights for smarter decision-making. That’s where ETL in Power BI comes to the rescue.
In this article, we’ll explain what ETL is in Power BI, why it is not an ETL tool, and how to perform extract, transform, and load tasks using the built-in Power BI tools. We’ll also define the main ETL challenges for Power BI and how dedicated ETL tools may help.
Table of contents
- What is Power BI?
- What is ETL?
- Why you need ETL in Power BI?
- Is Power BI an ETL tool?
- How to perform ETL in Power BI
- ETL Challenges in Power BI
- Skyvia ETL Tool for Power BI
- Conclusion
What is Power BI?
Power BI is a collection of software services, apps, and connectors that combine to turn unrelated data sources into coherent, visually immersive, and interactive insights. – Microsoft Docs.
It’s a diverse business intelligence platform designed by Microsoft. It helps organizations analyze and visualize raw data and make decisions. It transforms raw data into meaningful insights through the following features:
- Interactive visualizations
- Advanced analytics
- Real-time dashboards
- Data transformation
You can use the Power BI desktop version, cloud Power BI Service, or Microsoft Fabric.
What is ETL?
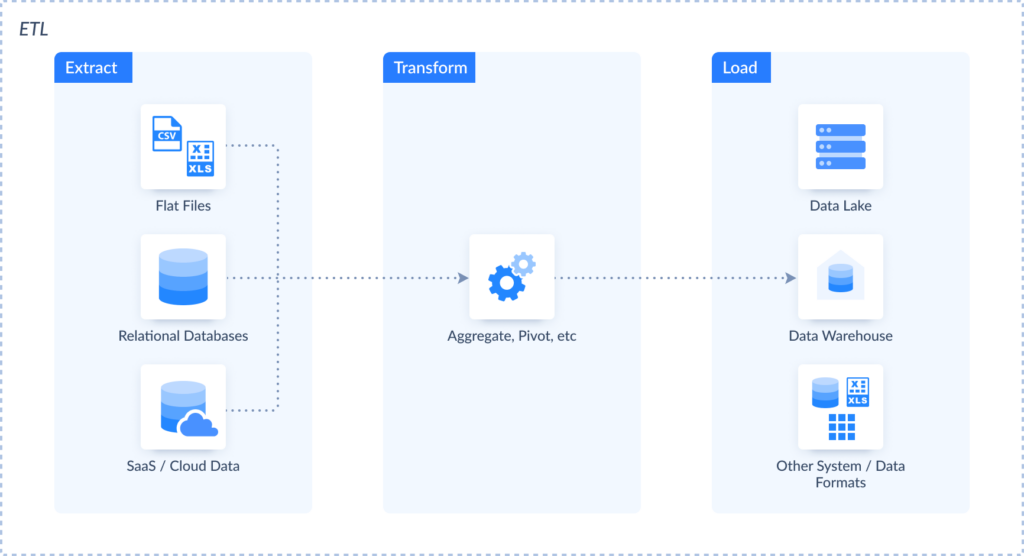
ETL is an acronym that stands for Extract, Transform, and Load. It is a process of obtaining data from one or more sources, transforming it, and loading it into a consolidated repository, such as a data warehouse, data lake, or other system, in a data pipeline that integrates different sources.
Check the ETL process scheme on the diagram below.
There is a variety of ETL-dedicated tools that fully support extract, transform, and load processes: Skyvia, Informatica, Talend, and others. All of them have common features. They all support multiple sources and multiple destinations. These tools allow you to move your data from any supported source to any supported destination, performing advanced transformations.
Why you need ETL in Power BI?
Adding the ETL process to the Power BI environment is highly useful for producing clear datasets that are the valuable foundation for analytics and reporting.
ETL helps to transform it to ensure consistency and accuracy and load it into Power BI for visualization.
For instance, by using ETL to standardize data formats and eliminate inconsistencies, businesses can generate more accurate reports, leading to better decision-making. Without ETL, organizations might struggle with inconsistent data formats and manual data preparation, which can hinder the effectiveness of their analytics efforts.
Is Power BI an ETL tool?
It may seem that standalone Power BI can also be called an ETL tool. However, that’s not quite so. Power BI is primarily a business intelligence platform whose tools may comprise some ETL capabilities. It is designed to help users with analysis, reporting, and visualization. It allows you to create interactive reports and build dashboards. Power BI includes Power Query and Power BI dataflow, which can solve some ETL-like tasks.
Let’s figure out how they perform ETL in Power BI.
How to perform ETL in Power BI
You can use several tools in Power BI that may help you with ETL.
Using Power Query for ETL
Let’s implement ETL in Power BI using Power Query. It is the built-in data preparation engine that involves the following capabilities:
- Extract: the ability to connect to different sources and extract data from them.
- Transform: its visual editor enables various data transformations such as sorting, grouping, column splitting, and more.
- The Load stage involves loading the extracted and transformed data to a separate destination, such as a database or data warehouse. In this case, the extracted and transformed data remain inside Power BI or are loaded into Azure Datalake.
To see this in action, let’s use Power Query ETL for an SQL Server data warehouse in Power BI.
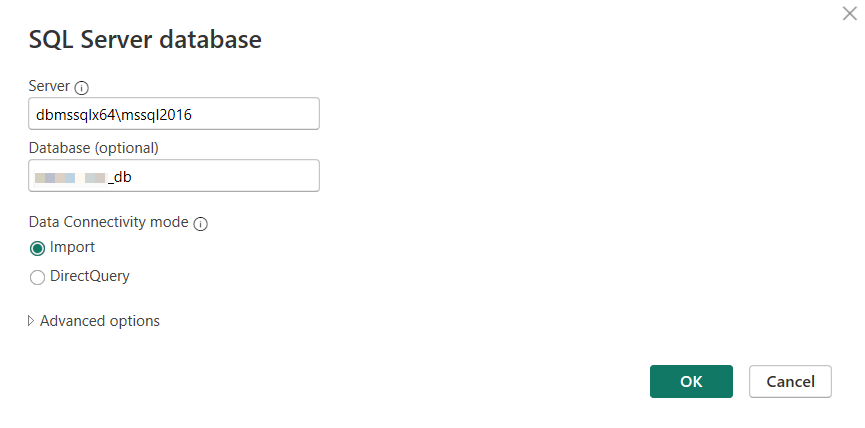
STEP 1: Connect to the Data Source
For this example, we use SQL Server Database as the data source.
Specify the connection settings for the source. You may be asked for a user ID and password upon clicking OK.
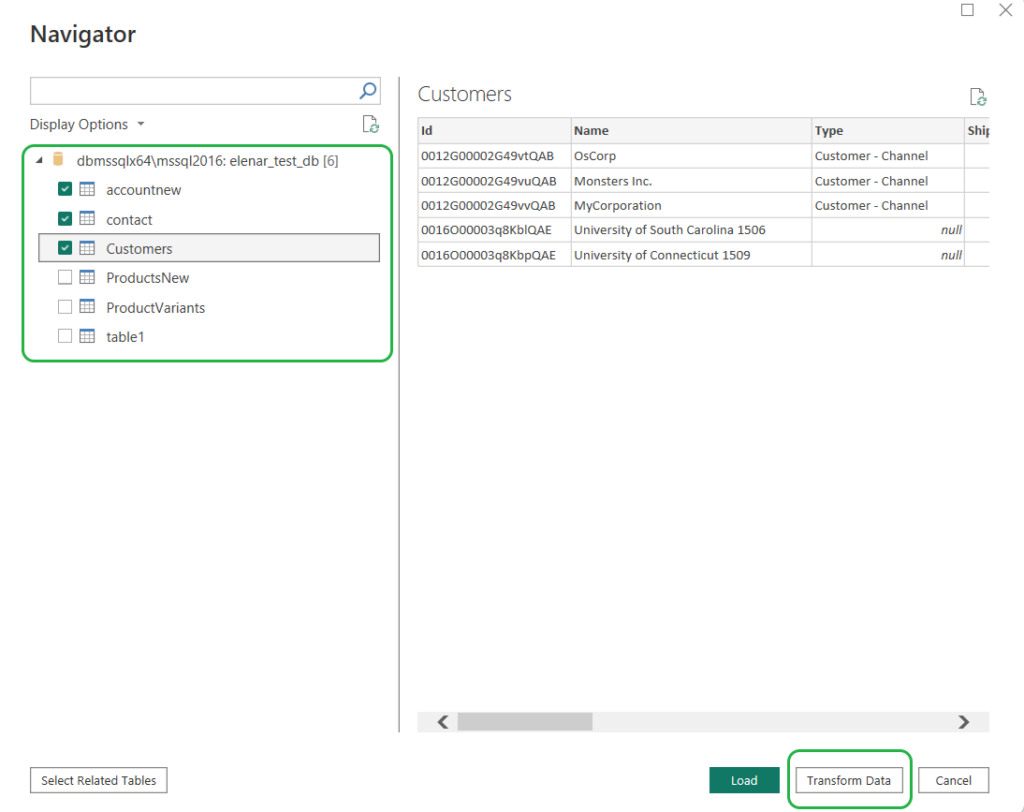
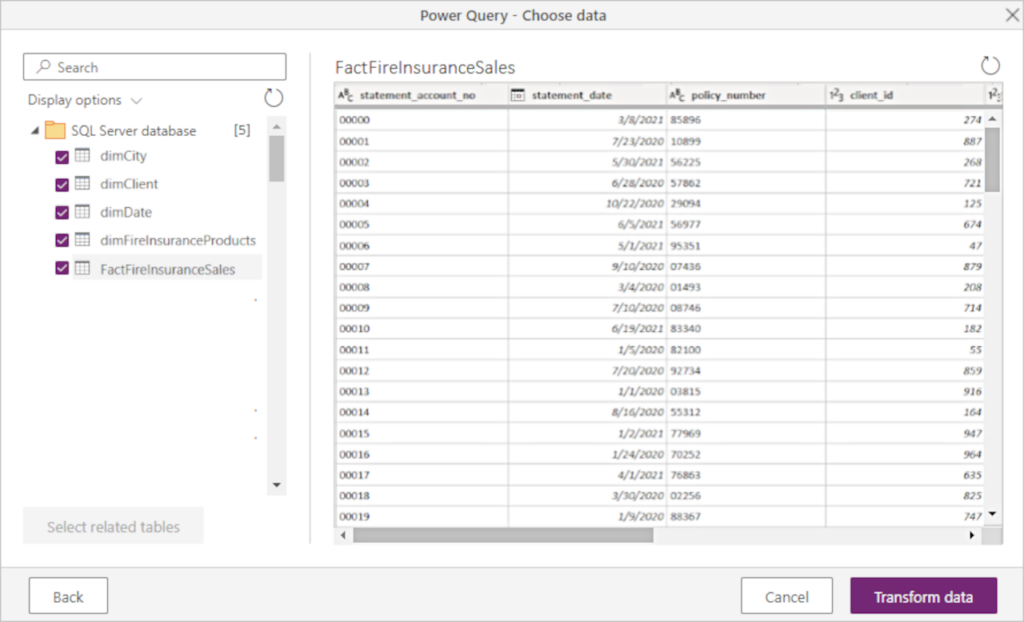
STEP 2: Select Data
Select the tables you want to include in the report and click Transform Data to start the next step.
STEP 3: Transform Data
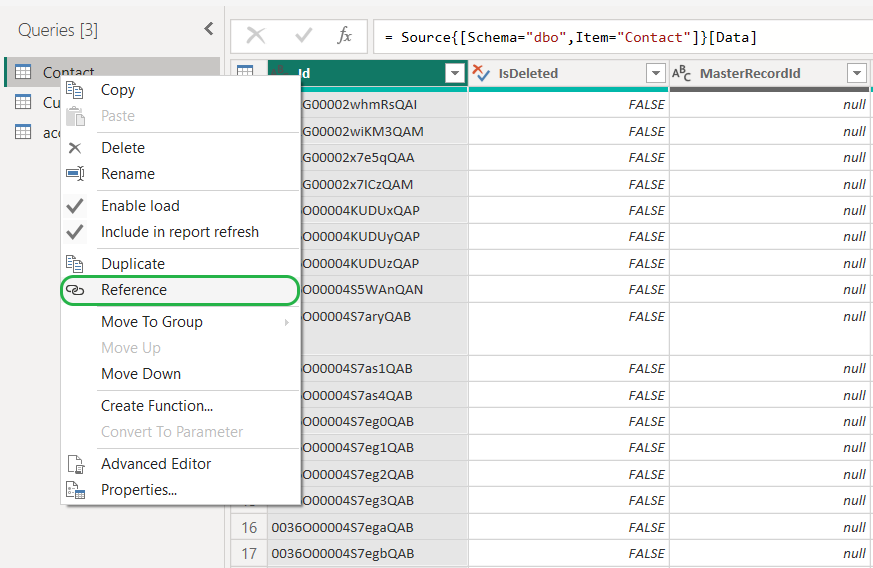
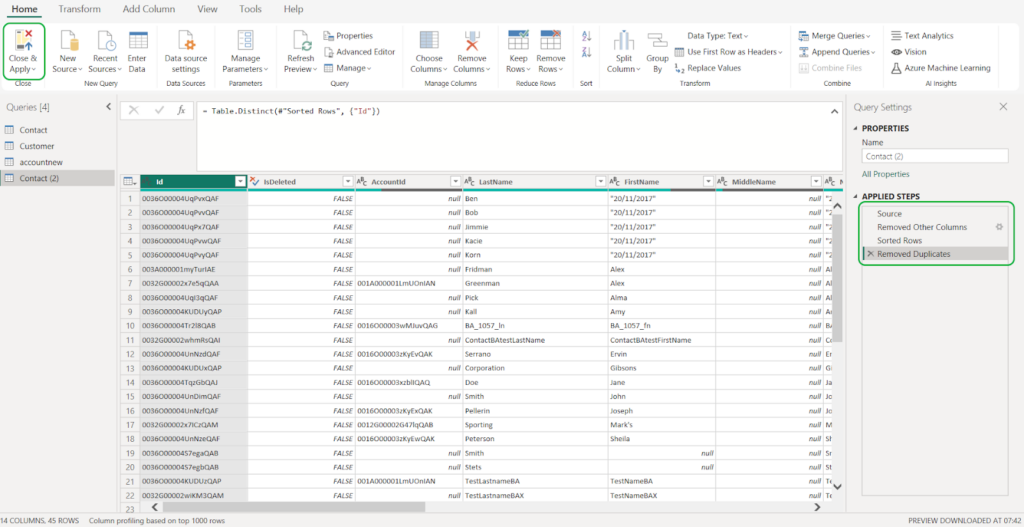
Power BI offers various transformations, from simple sorting or grouping to running Python scripts. Below, we demonstrate several simple actions. Let’s try to clean up the source for the report. We select the specific columns, sort the data, and split them into one of the columns:
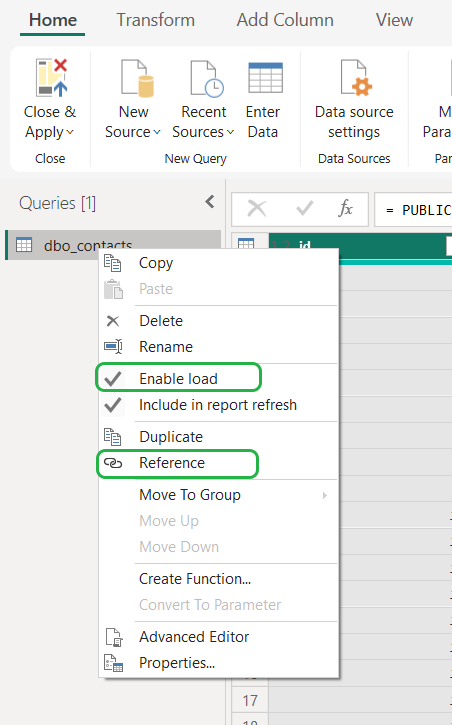
- Create a new query by referencing an existing table. Right-click the table from which you want to create a new query and select Reference. Another query with *(2) suffix will appear.
- Click Choose Columns and select Choose Columns again to include/exclude the necessary data in the report.
- Select the column by which you will sort the data and click the sorting button.
- Let’s remove duplicated records. Click Remove Rows and select Remove Duplicates.
All the performed transformations appear in the right pane under Applied Steps. You can select any of them to modify a step.
Using Power Query M Formula Language for ETL
Though Power Query has a user-friendly editor, you may need to perform advanced transformations that the graphic editor does not cover. Thus, all the performed transformations are coded behind the scenes using the Power Query M formula language, also known as M. For example, the following M code represents all the actions done above:
let
    Source = Contact,
    #"Removed Other Columns" = Table.SelectColumns(Source,{"Id", "IsDeleted", "AccountId", "LastName", "FirstName", "MiddleName", "Name", "Phone", "MobilePhone", "Email", "Title", "Department", "CreatedDate", "LastModifiedDate"}),
    #"Sorted Rows" = Table.Sort(#"Removed Other Columns",{{"Name", Order.Ascending}}),
    #"Removed Duplicates" = Table.Distinct(#"Sorted Rows", {"Id"})
in
    #"Removed Duplicates"
If you want to do advanced transformations using the Power Query engine, you can use the Advanced Editor to access the query script and modify it as you want.
- When finished, click Close & Apply. As a result, your data will be imported to Power BI Desktop.

Using Power BI Dataflows for ETL
Dataflow is another tool which can perform the ETL-like tasks. Power BI Dataflows are collections of entities or tables created and managed in workspaces in the Power BI service. This is much like a table in your database. You can use dataflow output in other Microsoft products and services.
When you use Power Query, all the transformations you perform remain within the product where you use it. Dataflows don’t limit you by Power BI or Excel. You can store the dataflows output in other storage options, such as Dataverse or Azure Data Lake Storage Gen 2.
Note: Dataflows are available for users with a Pro license and a Premium Per User (PPU) license.
Creating Dataflows In Power BI Service
This method is suitable for users of the standalone Power BI Service, which is now a component of Microsoft Fabric.
Creating Dataflows is similar to the one we did with Power BI Desktop because of ETL Power Query. But first, log on to your Power BI Service. Open your workspace and click New. Then, select Dataflow.
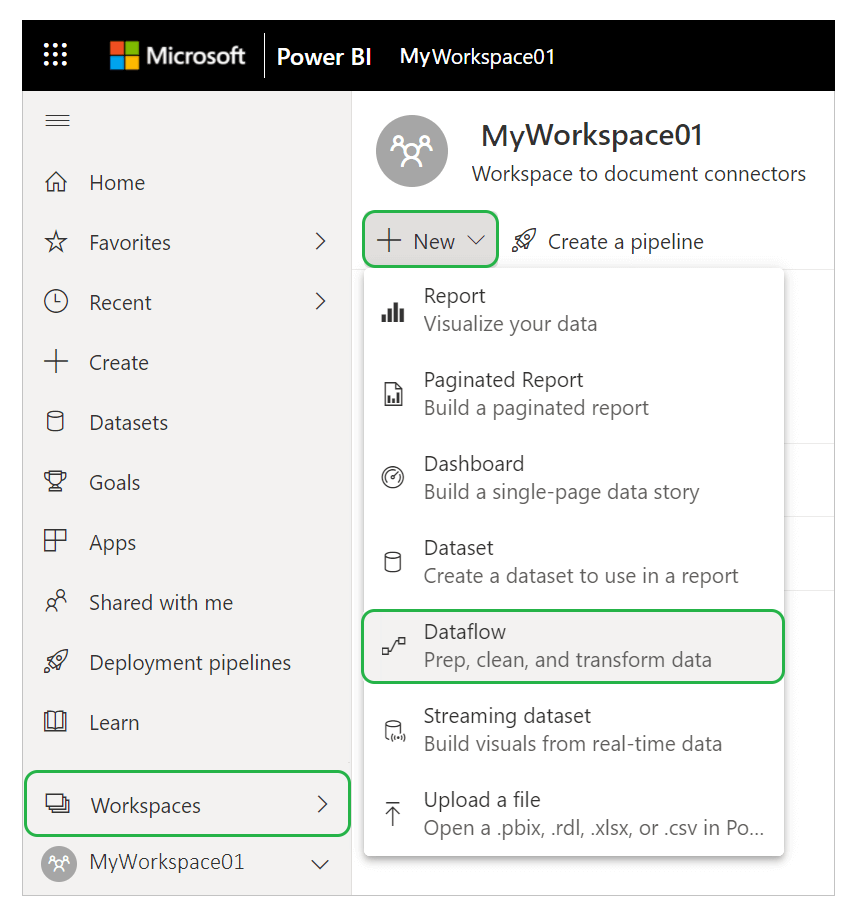
There are five options for creating a Dataflow:
- New data source
- Linked tables
- Computed tables
- Import/Export
- CDM folder
Let’s look at each of them in detail.
Create Dataflows Using New Data Source
This method allows you to connect to a source and select the needed tables.
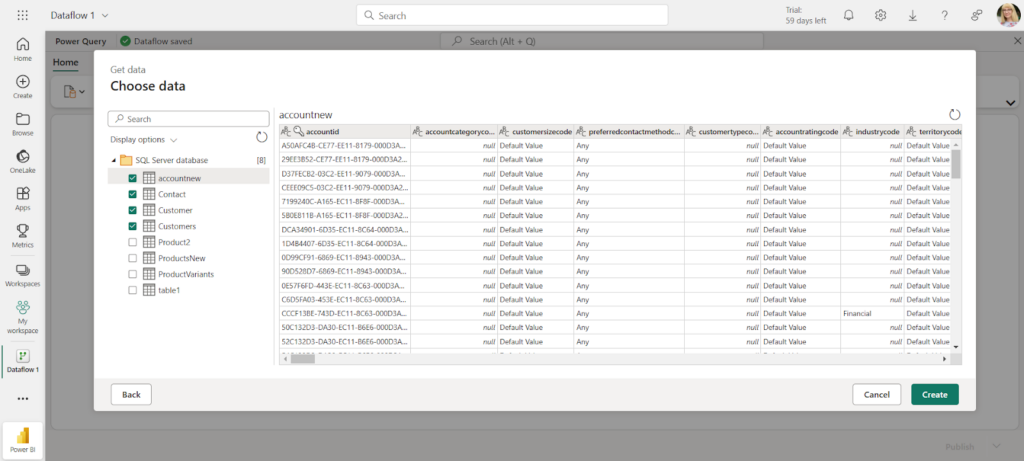
- Click Get Data and select the source.
- Connect to the source.
- Select objects to extract.
- Once you checkmark all the needed tables, click Transform data. Perform the necessary transformations.
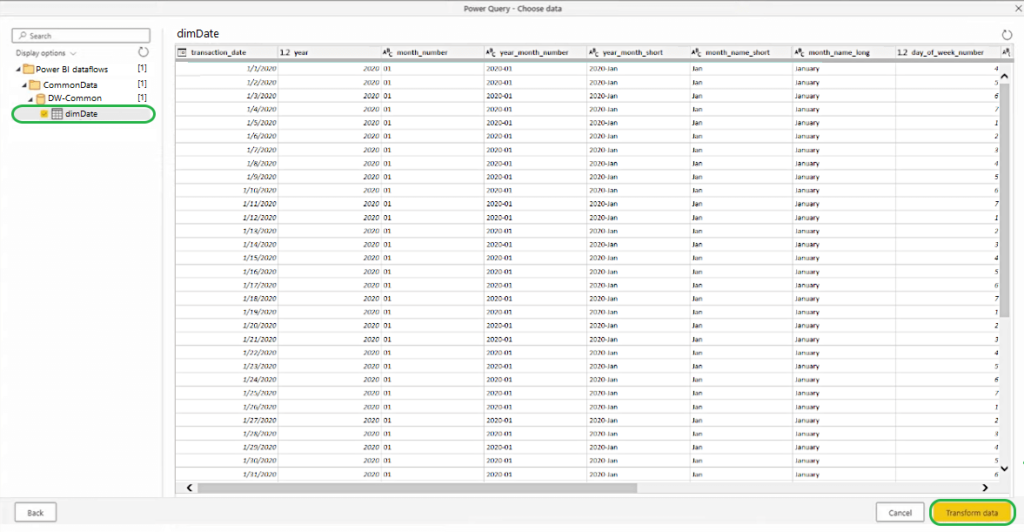
Create Dataflows Using Linked Tables
The second method implies creating a link to an existing table to reuse the existing table in different Dataflows. Select the needed table in a tree hierarchy of dataflows and tables, and click Transform data.
Create Dataflows Using Computed Tables
The third method implies referencing a table and performing in-storage calculations. These calculations don’t involve an external source. The result is a new table called a computed table.
To edit a linked table, right-click a table and select Enable load.
Then, rename the resulting computed table and make any necessary transformations.
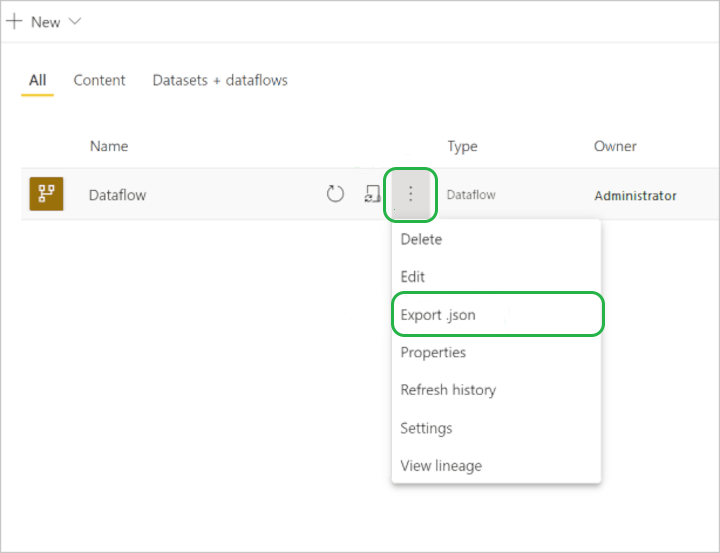
Create Dataflows Using Import/Export
This method allows you to export an existing Dataflow to a JSON file.
To import the model we just exported, go to another workspace and create a new Dataflow. And then choose the Import model. Then, browse for the JSON file you exported and click OK.
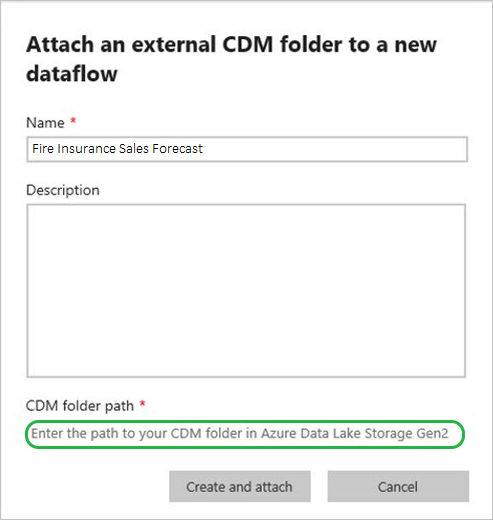
Create Dataflows Using CDM Folder
This method allows you to reference a table written by another application in the Common Data Model (CDM) format. You need to provide the complete path to the CDM file stored in Azure Data Lake Storage Gen 2.
NOTE: You need to have permission to access that folder.
To create a new Dataflow, click Create and attach.
Power BI Dataflows Next Steps
You can use the Dataflows you created in Power BI Desktop.
To select dataflows, you must sign in to the Power BI Service and choose the tables you need in your report.
There’s so much more about Dataflows as an ETL tool in Power BI than we can discuss in this article. Visit these valuable links for more information:
- Benefits of using Power BI Dataflows and their use cases.
- Configuring Incremental Refresh for faster loading.
- Limitations and considerations in using Power BI Dataflows.
- Power BI ETL best practices using Dataflows.
Create Dataflow Gen2 in Microsoft Fabric
Microsoft Fabric is an all-in-one analytics platform that covers everything from data movement to data science, real-time analytics, and business intelligence. Microsoft Fabric consolidates several Azure data workloads with Power BI so that users in different roles and teams can collaborate in one environment. To create a Microsoft Fabric dataflow, perform the following steps.
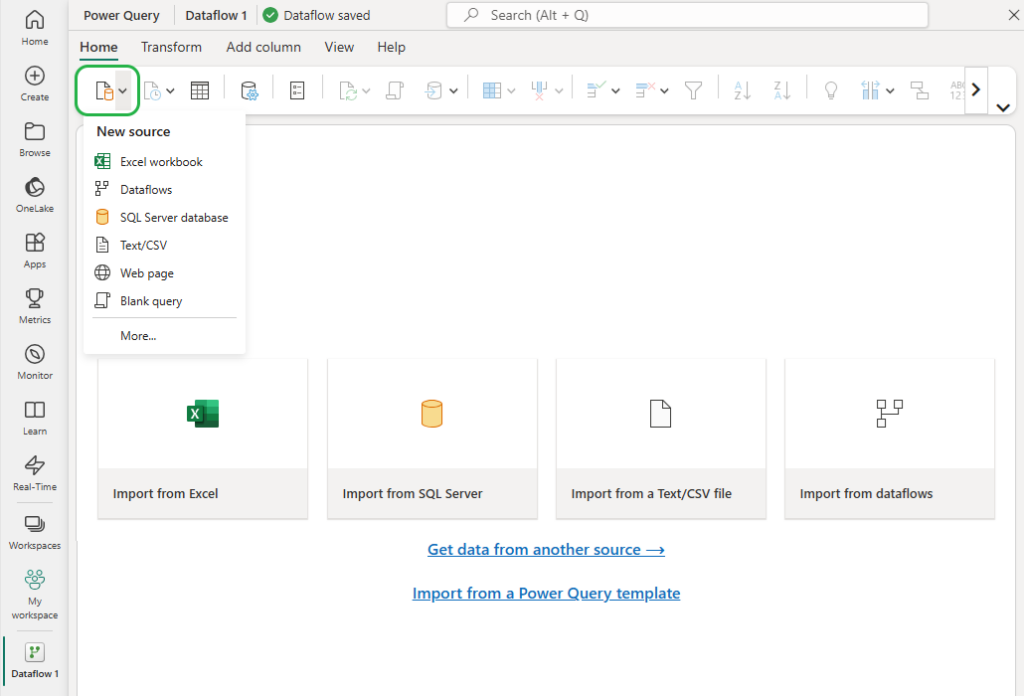
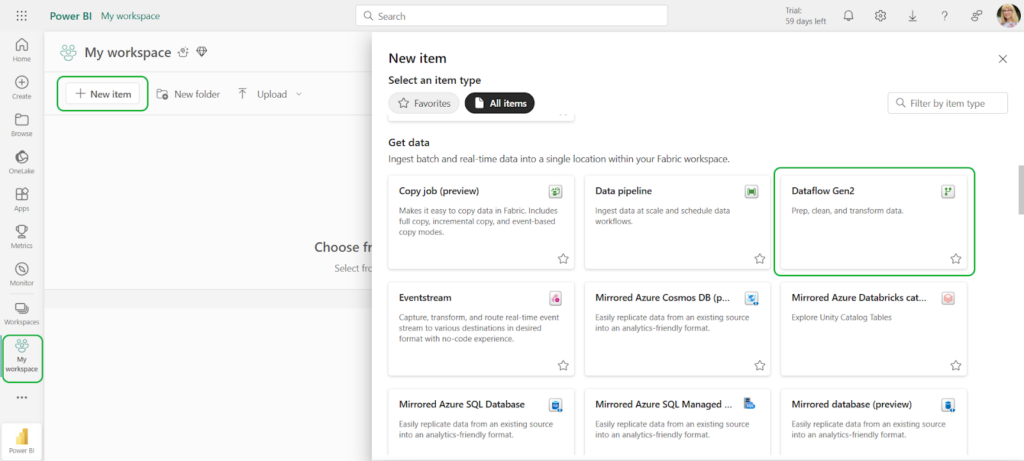
- Start by adding a new dataflow to your workspace. Go to your workspace, click New Item, and select Dataflow Gen2.
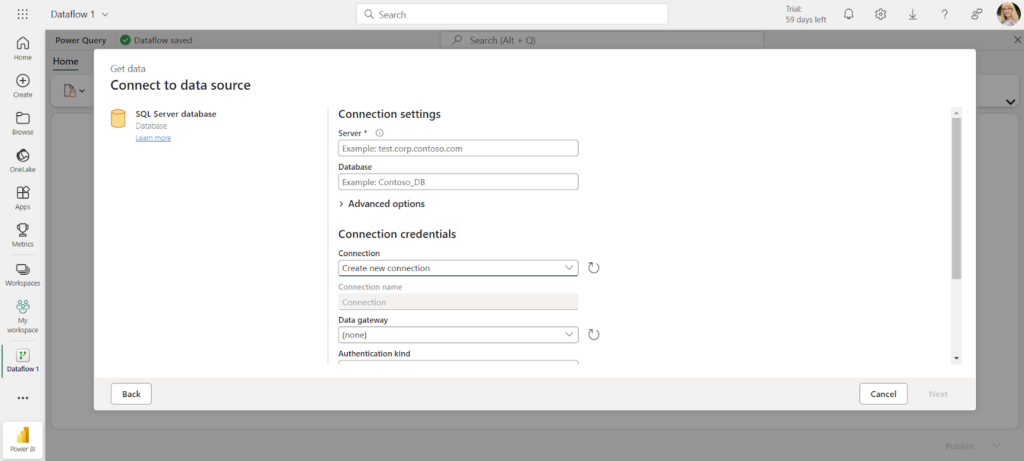
- Click Get data or select a source using New source in the ribbon. We select SQL Server for our example.
- Specify the connection settings.
NOTE: Make sure that your database is accessible from the internet.
- Select the tables to include in the dataflow and click Create.
- Use the dataflow editor to transform the data into the necessary format and publish them when you finish.
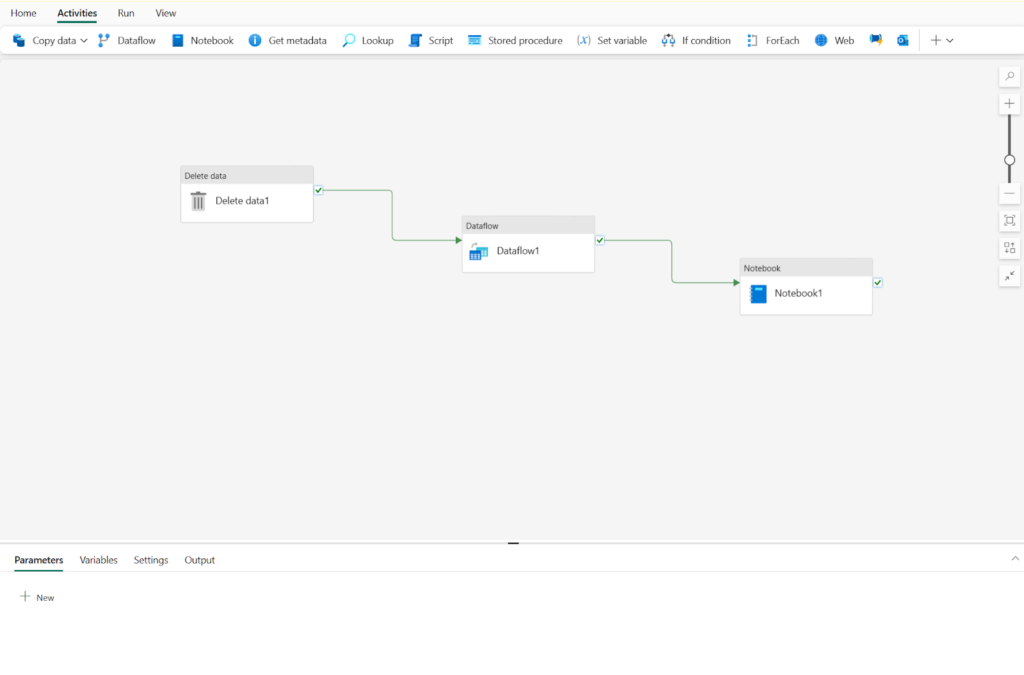
Using Microsoft Fabric Data Pipelines for ETL
Pipeline is a new solution by Microsoft Fabric that enables performing ETL for reporting and analysis. It helps to create pipelines that manage data ingestion and perform transformation tasks. In contrast to Power BI ETL capabilities, pipelines comprise extract, transform, and load components, enabling the data to be loaded into supported databases or data warehouses.
Pipelines enable performing executable tasks against the source, applying transformations, and building the logical flow for these tasks, making Fabric a serious competitor in the ETL tools market.
Note: Though pipelines significantly enhance the Power BI ETL experience, they are designed for business intelligence only. You can’t use them as an independent data integration or automation solution. Pipelines also face the same challenges as other Power BI ETL tools.
ETL Challenges in Power BI
The business intelligence tools offer ETL-like capabilities but don’t fully cover the entire ETL process. Businesses may face several challenges:
- Automation: though Microsoft Fabric supports a complete ETL cycle, it is tied to analytics and reporting and doesn’t function as a standalone automation process.
- Scope: Power BI ETL tools are designed for self-service and lightweight data preparation. It is not suitable for large-scale, enterprise-level ETL processes.
- Sources and Destinations: Microsoft supports only several destinations. Standalone Power BI services can load data from various sources, but the only destination is PowerBI itself or an Azure Data Lake.
- Performance: poorly optimized queries in Power Query can cause poor performance and excessive memory usage. Import connection mode can speed things up, but it increases dataset size, while DirectQuery connection can suffer from slow query execution, especially with complex joins and aggregations. More details are available in the Microsoft optimization guide.
- Complex Transformations: Power BI and Fabric tools are great for basic transformations, but when dealing with complex multi-step ETL processes, advanced data manipulation, and execution logic, they give in to dedicated ETL tools. Writing complex M-codes for these scenarios requires special technical skills and involves manual intervention.
You are free to overcome these challenges by trying query optimization, proper data modeling, and efficient use of storage modes techniques. However, for the best ETL experience, a dedicated ETL tool like Skyvia or others is a game-changer.
ETL-dedicated tools can solve a wide range of data-related tasks, such as data migration, bulk loads, complex pipelines, etc. They usually support various cloud apps, databases, data warehouses, and storage services. All of these apps may serve as both sources and targets for ETL. When dealing with complex multi-step ETL processes, advanced data manipulation, and execution logic, BI tools give in to ETL tools.
Let’s look at a simple example in Skyvia.
Skyvia ETL Tool for Power BI
Skyvia is a cloud platform suitable for multiple data-related operations: data warehousing, ETL and Reverse ETL, workflow automation, etc. You can easily load information into a data warehouse by using Skyvia, and it will then be analyzed with Power BI. Moreover, Skyvia is code-free, which means that any setup is done in the visual wizard.
Below, we show you how to extract data from a cloud source, transform and load them to a data warehouse, and then use them for analysis in Power BI.
We use Skyvia Replication, which copies source data and its structure to databases and data warehouses.
STEP 1: Connect to the Source
- Log into Skyvia or create an account.
- Go to +Create New->Connection and select the source from the list.
- Specify your credentials.
STEP 2: Load Cloud Data to Data Warehouse
- Go to +Create New->Replication in the top menu.
- Select the app of your choice as a source.
- Select a preferred data warehouse as a destination. Skyvia supports Amazon RedShift, Google BigQuery, Azure Synapse Analytics, Snowflake, and other popular data warehouse platforms.
- Select the objects for replication.
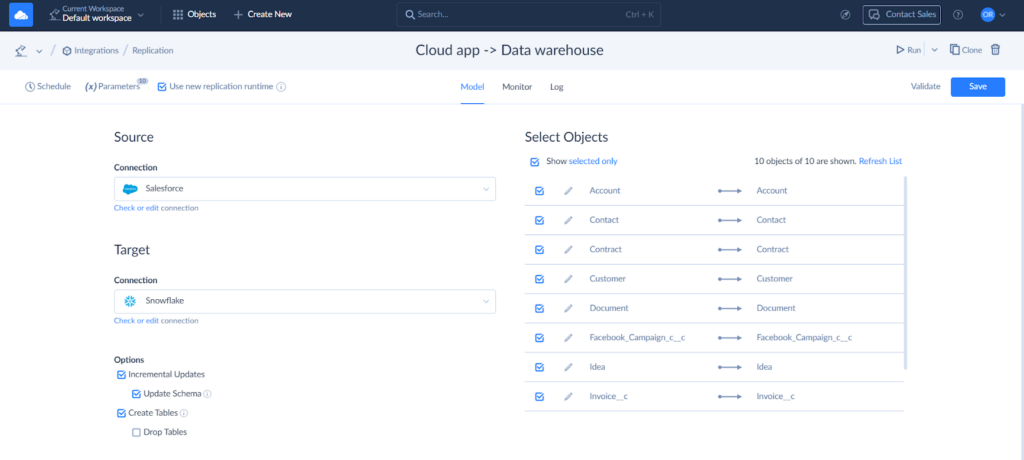
- Configure objects for replication on the right. Click Edit to open the task editor for an object. Here, you can select specific fields to replicate, set the target table name, and specify replication settings.
Skyvia also allows you to address compliance requirements with hashing. Select specific object fields to hash, ensuring the secure transfer of sensitive data.
- Set filters, if needed, and save the task. Name the replication and save it. You can run the replication manually or based on schedule.
STEP 3: Load Data into Power BI
Power BI offers native integration with major data warehouses. You can transfer the recently uploaded information from the data warehouse (in this example, Snowflake) to Power BI.
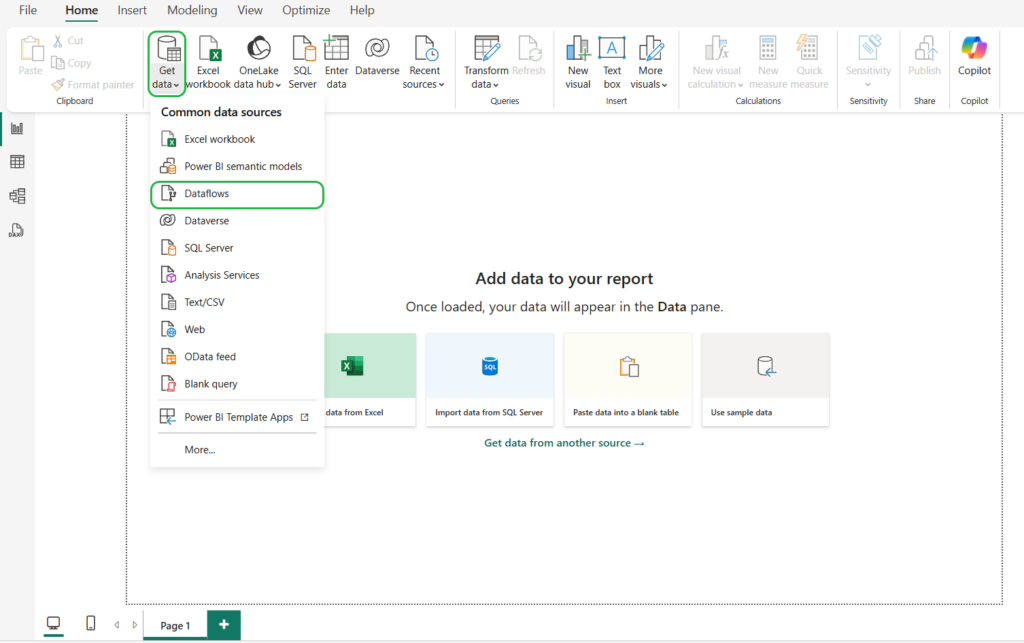
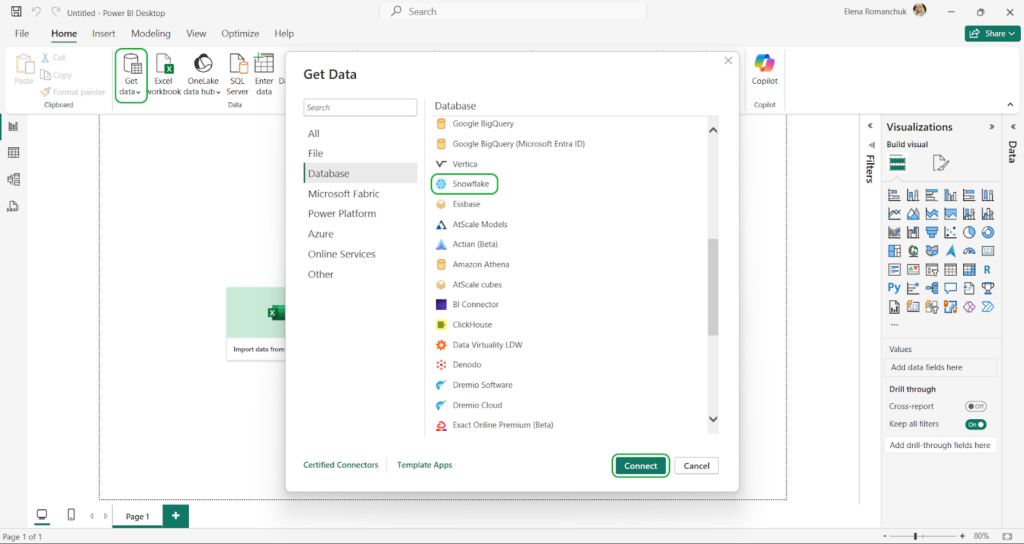
- In Power BI, select Get Data and type Snowflake in the search bar.
- Select Snowflake on the list and click Connect.
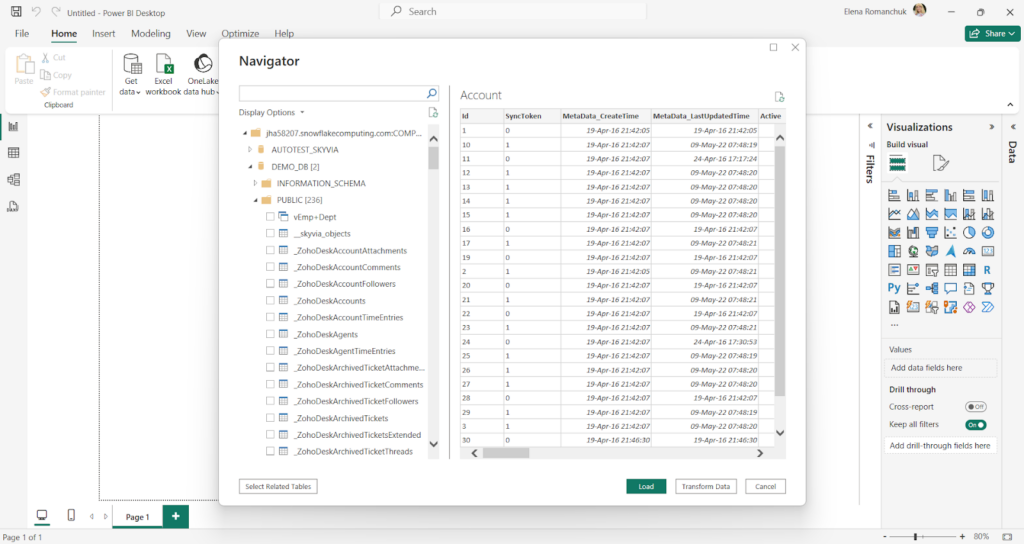
- Enter your Snowflake credentials.
- Once the connection is established, the Navigator window with available objects on the server appears. Select the needed source objects and click Load to pull it into Power BI Desktop.
As we’ve just observed, Skyvia perfectly carries out data warehousing scenarios with ELT.
Skyvia ETL, ELT, Reverse ETL Features
The case we demonstrated is only one of the various use cases of using Skyvia for ETL. Skyvia offers several products that enable not only ETL but also ELT and Reverse ETL implementation. Some of the most popular Skyvia tools are listed below:
- Import tool is suitable for ETL and Reverse ETL.
- Data Flow, Control Flow for complex data transformations, and orchestration across compound pipelines.
NOTE: Skyvia’s Data Integration product also offers export to CSV files functionality and synchronization between sources.
- Use Connect to create OData and SQL endpoints for your data in less time with no coding and in convenient wizards.
- Automation helps automate workflows by performing actions based on events.
Skyvia vs. Other ETL Tools
No doubt, Skyvia is a robust ETL solution, but it works with different data integration scenarios. However, it’s not unique in its market genre. There are pretty many similar solutions by competitors. Let’s have a look at other popular data integration solutions and see how they are different from or similar to our platform. The best way to start is by providing a comparison table with several critical parameters.
| Skyvia | Informatica | Stitch | Hevo | |
|---|---|---|---|---|
| Focus | ETL, ELT, Reverse ETL, data sync, workflow automation | ETL | ETL, ELT | ETL, Reverse ETL, ELT |
| Skill level | No-code and visual wizard | No-code, low-code | No-code, low-code | No-code, low-code |
| Sources | 200+ | 100+ | 140+ | 150+ |
| The ability for customers to add other sources | With REST API | With Connector Toolkit Developer | With Singer, Import API, or Incoming Webhooks | With REST API |
| G2 customer satisfaction rate | 4.8/5 | 4.4/5 | 4.5/5 | 4.3/5 |
| Compliance with safety certificates | HIPAA, GDPR, PCI DSS.ISO 27001 and SOC 2 (by Azure) | SOC 1, SOC 2, SOC 3, HIPAA / HITECH, GDPR, Privacy Shield | SOC 2 Type II, HIPAA BAA, ISO/IEC 27001, GDPR, and CCPAR | SOC 2, HIPAA, GDPR, CCPA |
| Pricing | Volume- and feature-based.Has a free plan. | Consumption-based. | Volume- and feature-based.Has a 14-day trial. | Consumption-based pricing based on Hevo events.Full-feature 14-day free trial.Has a free plan. |
Compared to its major competitors, Skyvia supports the largest number of data integration scenarios and sources. It also has the highest rankings for usability on the G2 review platform.
In terms of skill level requirements, all tools are very similar, as each of them offers no-code and low-code interfaces. Each service also strongly complies with modern security protocols and certificates.
As for pricing, Skyvia and Hevo offer a free plan with limited monthly data volume and features. Pricing plans for all tools rely on a consumption-based model that considers data size and feature set.
Conclusion
ETL plays a significant role in working with Power BI, ensuring data accuracy, consistency, and usability for analytics and reporting. Though we can’t call Power BI an ETL tool, it still offers powerful built-in ETL features like Power Query and Dataflows that help perform ETL tasks for analyzed data.
Now you know how to perform ETL using Power BI tools and what challenges you may face due to this. Together with that, such solutions like Skyvia solve these problems, enabling a seamless, code-free way to integrate, transform, and load data from various sources to Power BI. They provide businesses with robust ETL, ELT, and Reverse ETL solutions.