SQL Server Data warehouse? Sounds boring. Who would want to learn this? But what if I tell you that data analysis is one of the sought-after skills today?
If “data warehouse SQL” is a question you frequently type into Google, you’re not alone. As businesses generate and rely on vast amounts of information, understanding how to store, manage, and query it efficiently becomes crucial. Data warehouses are the backbone of modern analytics, and SQL is the universal language with which to interact. Whether you’re looking to optimize your queries, integrate information from multiple sources, or simply understand the basics, this article will guide you through the essentials of using SQL in a data warehouse environment.
This guide should be easy for everyone, no matter how much experience you have in SQL. You can follow the example described below on your PC. Simply download and install the SQL Server Community Edition for free.
Table of contents
- What is a Data Warehouse?
- Advantages of DWH SQL Server
- How to Build SQL Server Data Warehouse
- ETL Tools for Data Integration
- Conclusion
What is a Data Warehouse?
A data warehouse is the central repository of information for analysis, artificial intelligence, and machine learning. To make the warehouse efficient, data is loaded from different sources, like transactional databases, flat files, or cloud storage, and should be regularly updated.
The illustration for a typical data warehouse environment is shown below.
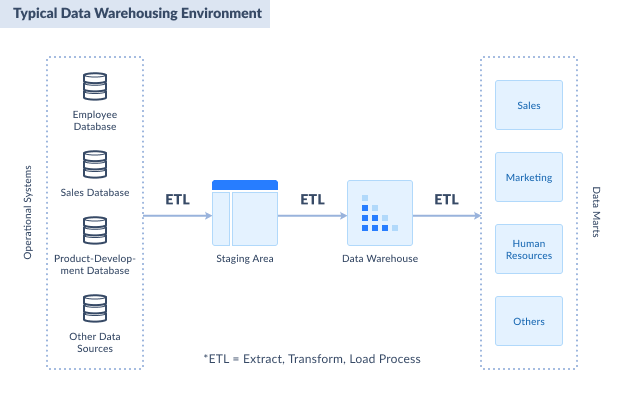
The first part of the diagram is the sources of data. These are databases from transactional systems. It can be in SQL Server or another relational database. It can also be from flat files like CSVs, Excel, XML, and text.
Afterward, you consolidate all the necessary records from the source into a single format called the staging area. For simplicity, you can also implement the staging area in SQL Server.
Then comes the data warehouse SQL Server with a dimensional model. We will discuss how to make one with an example later.
The final part of the diagram is different data marts. A data mart focuses on one aspect of the business, like sales, purchasing, and more. In this article, we will make a data warehouse with one data mart for insurance policy sales.
SQL Server data warehouse needs to be modeled for efficient processing. Next, we’ll review its components, focusing on the dimensional model and its role.
Dimensional Model
Here are some key terms used in the dimensional model.
FACT TABLE
A fact table contains all the facts about a business entity or process. It’s at the center of the schema, surrounded by dimensions. A fact table may be about sales, ticket support, projects, etc. You can implement this as an SQL database table. Columns include the ID keys of dimensions and measures.
Each record in the fact table will determine how detailed a fact table is. There can be several fact tables in a data warehouse defining different business processes in one warehouse. Each of them can share dimensions about location, date, and more.
DIMENSIONS
Dimension categorizes facts and measures in a fact table. For example, the city or region dimension describes a customer’s location in a sales transaction. Other examples of dimensions are customer and product in a sales business. Dimensions also enable users to answer a business question. For example, “How much did we earn from Product X this month?” In this question, the Product is the dimension of a Sales fact.
Dimension is implemented as a table referenced by the fact table. It includes a primary key and the key description or name, such as a product ID and name. However, more can be defined within a dimension to categorize it and further build a hierarchy. For example, product category and subcategory describe a product.
The primary key of each dimension can be different from the primary key of the source table. This happens when a table of customers from one database is combined with a table of customers from another. It’s also called a surrogate key.
MEASURES
The measure is a property of the fact table that allows calculation. This can be sum, average, count, minimum, or maximum. For example, you can sum sales amounts to form total sales.
Measures can be additive, non-additive, semi-additive, or calculated. The sales amount is an additive measure. You can sum or average it. But the unit price is non-additive. It may not make sense if you sum it up. Meanwhile, a calculated or computed measure is like its name. The total sales amount, for example, is calculated based on product unit price + tax.
Types of Data Warehouse Schema
The schema defines how information is structured in a data warehouse. Different schema types are designed to balance performance, storage efficiency, and query complexity. The choice of schema depends on the business requirements and data usage. Let’s review the most common types.
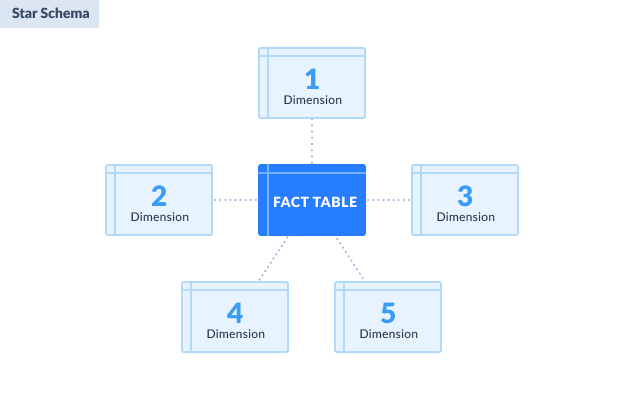
STAR SCHEMA
The simplest and the most widely used dimensional model is a star schema. It has the fact table at the center and the dimensions surrounding it. It can also be described as a parent-child table design. The fact table is the parent, while the dimensions are the children. But since it’s so simple, there are no grandchildren.
Common characteristics of star schema
- The fact table is at the center, containing dimension keys (foreign keys) and measures.
- Primary keys in dimension tables are foreign keys in the fact table.
- No dimension table references another dimension table. They are denormalized.
Advantages of star schema
- Simpler queries because of the simple design.
- Easily maintained.
- Faster access to records because of the denormalized dimension table design.
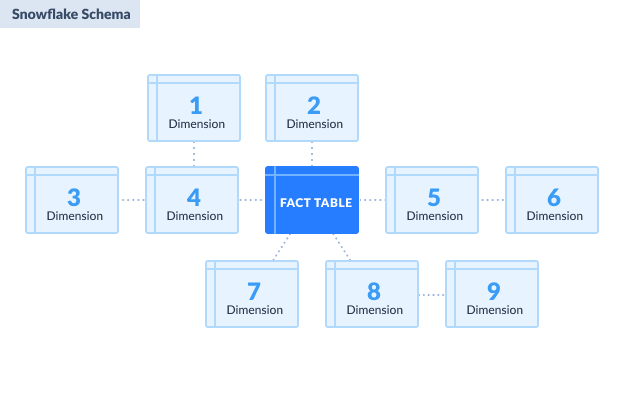
SNOWFLAKE SCHEMA
In a snowflake schema, dimension tables are normalized. The physical structure resembles a snowflake shape. Compared to a parent-child design, snowflake schemas can have grandchildren.
Common characteristics of snowflake schema
- A fact table is also at the center, like the star schema.
- The fact table references first-level dimension tables.
- Dimension table can reference another dimension table. This design is normalized.
Advantages of snowflake schema
- More flexible to changes in structure.
- Less disk space because of normalized dimension tables.
Advantages of DWH SQL Server
Choosing the platform is an essential step in building a data warehouse. SQL Server is an excellent option for many reasons:
- Integration with Existing Ecosystems
SQL Server is part of the Microsoft ecosystem and integrates with popular services such as Power BI and Excel, simplifying report creation and data visualization for organizations. - Scalability and Performance
Designed to support systems of various sizes, from small setups to enterprise-level data warehouses, it offers features such as partitioning and column store indexes. Faster data processing and improved query performance are substantial benefits. - Cost-Effectiveness
Multiple editions, including a free Community Edition, make this platform accessible to organizations with different budgets without losing core features. - Security and Compliance
Data protection is ensured through encryption, access controls, and auditing capabilities. The platform also complies with industry regulations like GDPR and HIPAA. - Advanced Analytics Integration
Built-in support for data science and machine learning makes it a good choice for implementing predictive models and gaining insights directly within the database. - Rich ETL Features
SQL Server Integration Services (SSIS) makes it easier to handle data extraction, transformation, and loading tasks across diverse sources. - User-Friendly Management
Tools like SQL Server Management Studio (SSMS) offer a straightforward way to set up and maintain data warehouses, catering to users with varying levels of expertise.
How to Build SQL Server Data Warehouse
Time to put the concepts above to practical use. In this example, we will use a fictitious company called ABC Insurance Co. The company sells fire insurance policies for residential houses, apartments, and business structures.
Our data warehouse example will have these simple characteristics:
- One (1) transactional database.
- The staging area will have a copy of the transactional database for the tables and columns needed.
- The data warehouse will use a star schema focusing on insurance policy sales.
Step 1: Get Business Requirements
To make informed decisions, analysts must be prepared to answer questions from stakeholders, such as business leaders or managers.
RECEIVE BUSINESS QUESTIONS
Output for this step:
- Business questions and their objectives.
- Answers to business questions in the form of reports and their formats.
Your stakeholders have questions in mind. Your role is to answer those questions so they can make informed decisions.
In our example, we only need to answer how many sales were made in a particular period. Of course, there are more. However, we will only answer this question to demonstrate the concepts we have learned.
To get the answers, pay attention to the current state of the system and the desired outcome. Ask for the report formats they need. Then, proceed to the next step, which is discussed next.
INSPECT THE SOURCE TRANSACTIONAL DATABASE AND CREATE THE STAGING AREA
Output for this step:
- Staging area database.
- Plan for extracting data from the source to the staging area.
The transactional database contains all the currently available information. For this example, we assume all the information we need can be found in the source database. If there is missing information, you must go back to your stakeholders. Then, resolve the matter separately. Then, go back to this step.
After seeing the source database, identify what tables and columns you need. You don’t need everything. If you need to clean the data, identify the steps you need to do it. You may need to clarify some parts of the stakeholders’ data.
Now, let’s assume that we already have what we need. Below, you can find a diagram of the database staging area.
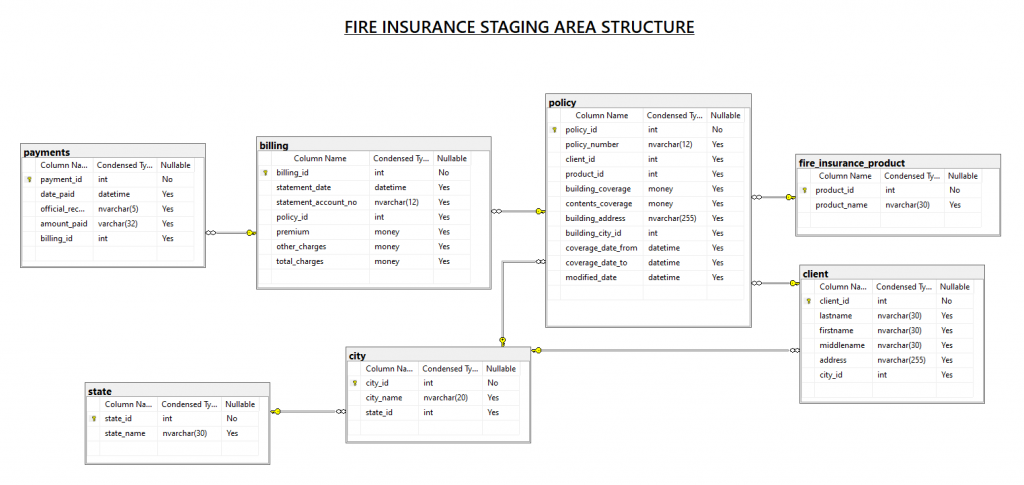
At this point, you need to plan how to get the data to the staging area. After this, you’re ready for the next step. But before we do that, I think this question deserves to be answered. Why create a separate database for the staging area?
Good point. You may ask, what’s wrong with getting the data straight from the transactional database? Our example uses only 1 database source. In the real world, you don’t just deal with sales. You can have other systems for purchasing, petty cash, payroll, and more. If these have separate databases, and you want to analyze them, this staging area may be good for them, too.
How would you know? Ask yourself whether there is information that these information systems can share. If yes, consolidating them into one staging area will be an advantage. One example of something that they can share is an employee list.
Another point is data cleansing. You don’t want to touch a working transactional system. So, you clean the data in the staging area. And one more point is the precalculation of aggregates. Before reaching the data warehouse, do you need to do some complex calculations or summarization? You can also do that in the staging area.
Step 2: Build the SQL Server Data Warehouse
Finally, we have reached the focal point of this article. Start by setting up a new SQL Server database specifically for the data warehouse.
Output for this step:
- SQL Server database for the data warehouse.
- Plan to populate the data warehouse from the staging area.
To create a new database for the data warehouse, launch SQL Server Management Studio. Then, right-click the Databases folder in the Object Explorer and select New Database. Name your database and set the database options. We named ours as fire_insurance_DW.
CREATE THE FACT TABLE
Now, let’s create new tables for the SQL Server. We will start with the fact table. For our fire insurance sales example, we have the structure as shown below.
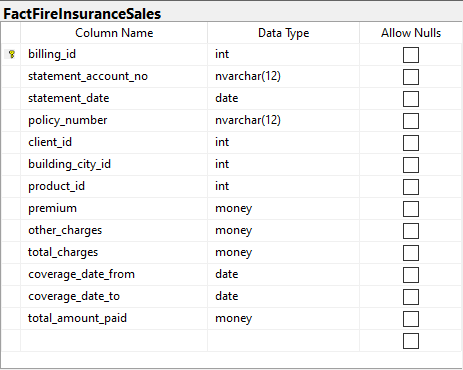
The fact table above includes 3 additive measures: premium, other_charges, and total_amount_paid. Meantime, total_charges is a computed measure based on premium + other_charges.
Please also pay attention to the foreign keys client_id, building_city_id, product_id, and statement_date. They will reference dimension tables later.
CREATE THE DIMENSIONS
Next, create the dimension tables. We have product, client, city, and date dimensions. Each serves a purpose in reporting. The table below shows all the dimensions in our data warehouse example.
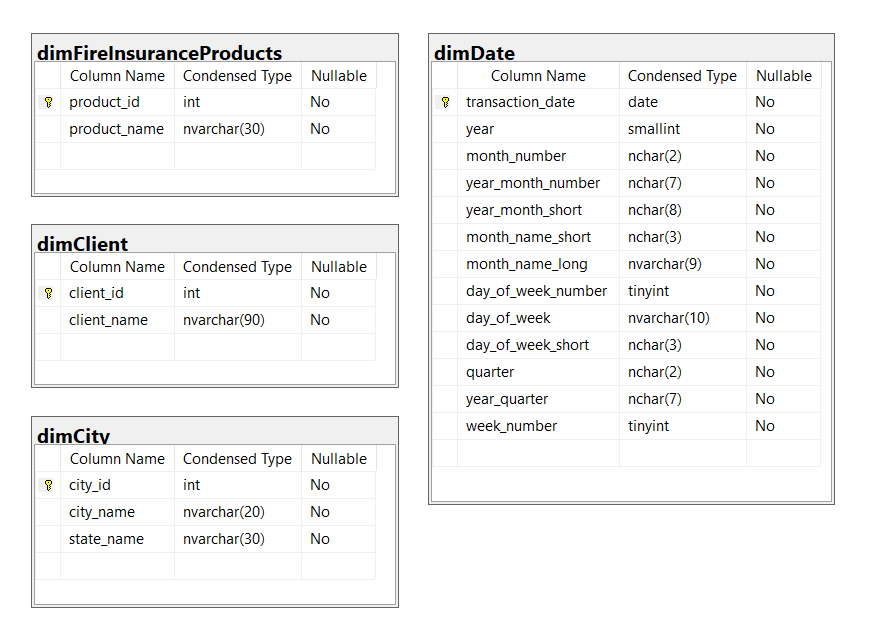
See each dimension in more detail:
- dimFireInsuranceProducts includes all fire insurance products. This dimension will categorize product-related figures like total premium sales by product.
- dimClient includes the list of clients who bought fire insurance policies.
- dimCity includes the list of cities within states. The state information is included, which makes this table denormalized. This defines the location of the property insured. If we made the data warehouse with a snowflake schema, another dimension table for the state should be created.
- dimDate is a date dimension that will filter sales by period. Users can filter from yearly to daily summaries.
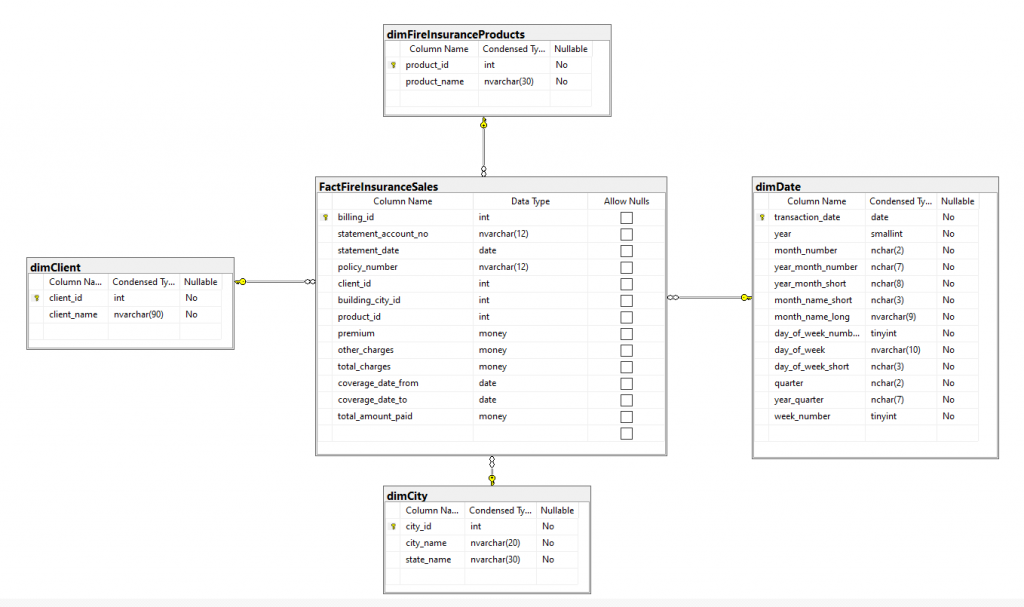
Check the final database diagram of our data warehouse below.
Analysis doesn’t end in creating the database for the data warehouse. So, what are the next several steps?
Step 3: Extract Data from the Transactional Database into the SQL Server Data Warehouse
Here, we will extract information from the source database, send it to the staging area, and send it to the data warehouse. Before you extract data, do not forget to create the field mappings from the source and target. You can find an example of fact table mappings below.
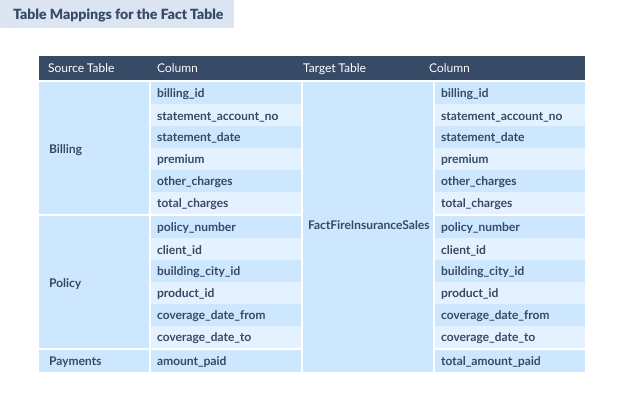
For the date dimension, you also need a script to generate data. The sample SQL code below will build a date table from 2020 to 2021. It uses the dimDate dimension table that we have in the data warehouse.
DECLARE @StartDate  date = '01/01/2020';
DECLARE @EndDate date = '12/31/2021';
;WITH seq(n) AS
(
    SELECT 0 UNION ALL SELECT n + 1 FROM seq
    WHERE n < DATEDIFF(DAY, @StartDate, @EndDate)
),
d(d) AS
(
    SELECT DATEADD(DAY, n, @StartDate) FROM seq
),
src AS
(
    SELECT
        [transaction_date]  = CONVERT(date, d),
        [year]          = DATEPART(YEAR, d),
        [month_number]      = FORMAT(d,'MM'),
        [year_month_number] = FORMAT(d,'yyyy-MM'),
        [year_month_short]  = FORMAT(d, 'yyyy-MMM'),
        [month_name_short]  = FORMAT(d,'MMM'),
        [month_name_long]   = FORMAT(d,'MMMM'),
        [day_of_week_number]= DATEPART(WEEKDAY, d),
        [day_of_week]       = DATENAME(WEEKDAY, d),
        [day_of_week_short] = FORMAT(d,'ddd'),
        [quarter]       =  'Q' + CAST(DATEPART(QUARTER,d) AS NCHAR(1)),
        [year_quarter]  = CAST(YEAR(d) AS NCHAR(4)) + '-Q' + CAST(DATEPART(QUARTER,d) AS NCHAR(1)),
        [week_number]   = DATEPART(WEEK, d)
    FROM d
)
INSERT INTO dimDate
SELECT * FROM src
ORDER BY transaction_date
OPTION (MAXRECURSION 0);
If you need more years, simply change the start and end dates in the script.
Step 4: Build the Sample Report
Finally, you can build the reports and dashboards your stakeholders asked for. You may use Excel because they are probably familiar with it. You can also use Power BI or SQL Server Reporting Services (SSRS).
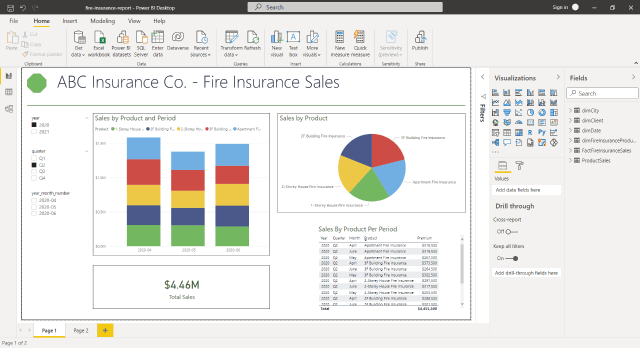
OUTPUT: SAMPLE REPORT
A possible report output for the data warehouse we’ve built is shown below. It uses Power BI to show product sales per period. A few more reports are possible with the data warehouse, like client sales or sales based on location.
ETL Tools for Data Integration
By itself, an SQL Server data warehouse is just a place for storing large volumes of information – it doesn’t automatically solve business problems or generate insights. If you want it to have value, it needs to become a part of your data ecosystem. This ecosystem can’t work without integrating your services and sources, and that’s where ETL (Extract, Transform, Load) processes step in.
How ETL Tools Solve Business Problems
- Data Synchronization: ETL tools bring information from different sources into a consistent environment. This allows businesses to get a 360-degree view of their operations.
- Consistency and Data Quality: tools apply rules to cleanse, standardize, and validate data. It is essential for reliable reporting and decision-making.
- Automate Data Workflows: scheduling and automation help you keep the records up-to-date between your sources and the data warehouses, reducing the number of errors and manual efforts.
SQL Server Integration Services (SSIS) is a popular on-premises ETL tool that is tightly integrated with SQL Server. It’s powerful but complex to set up and maintain, especially if you’re looking for a beginner-friendly or cloud-based solution. You can integrate SSIS with SQL Server Agent to schedule and automate this workflow.
While SSIS is a powerful tool, it has some drawbacks. SSIS is an on-premises solution, making setting up and running pricey. Plus, it’s not beginner-friendly — creating and managing workflows can be easier to set up in alternative solutions.
For those exploring alternatives, Skyvia provides a cloud, no-code solution. An intuitive tool that users love, backed by a 4.8/5 rating on G2 Crowd, and takes a spot among the top easiest ETL tools. Skyvia’s Data Integration product offers tools to help move data, combining ETL, ELT, and reverse ETL functionality.
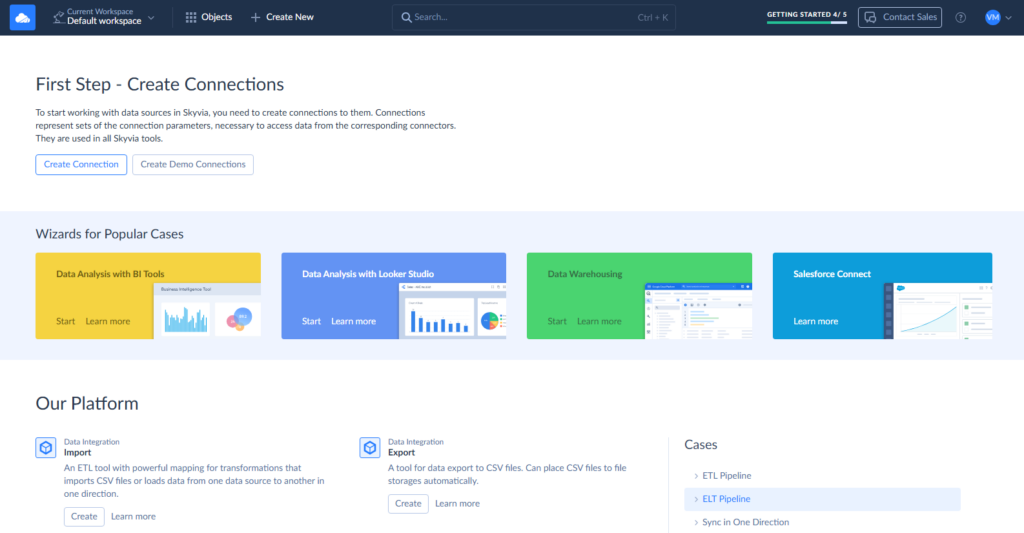
- Import is designed to gather data from different sources – cloud applications, flat files (CSV), or other databases into one target system. It features advanced mapping capabilities that let you configure field-to-field mappings, use expressions for transformations, and perform lookups to enrich your records. This functionality is useful for cases when you need to set up one-time or scheduled migrations without the need to use code.
- Replication allows you to keep the latest records from cloud applications at your fingertips. Once the initial replication is completed, the database is updated by pulling only the latest changes from the source. Set up the replication schedule and keep data current without manual effort.
- Data Flow offers a powerful data pipeline designer to work with complex scenarios. With Data Flow, you can join data from multiple sources using lookups and conditional splits, chain multiple transformation stages within a single workflow, and load the processed records into one or multiple targets.
See Skyvia’s capabilities yourself – try it out for free!

For a broader look at the ETL landscape and tips on selecting the right tool for your business, check out our blog post on ETL tools. It covers everything from on-premises solutions like SSIS to fully managed, cloud-based services like Skyvia — so you can choose the best fit for your organization’s needs.
Conclusion
Creating an SQL Server data warehouse is a straightforward way to transform your raw information into useful insights that can help you uncover trends, improve decision-making, and support business growth.
In this article, you learned how to build an SQL Server data warehouse from scratch. The example is simple; however, it covers most of the basic needs of the data warehouse. You can create a robust data warehouse in SQL by following the steps — gathering business requirements, designing and implementing the schema, extracting and transforming data, and creating insightful reports.
Let’s recap this topic with some key takeaways!
Key Takeaways
- Data warehouses are central information repositories for analysis, artificial intelligence, and machine learning. Data flows from different sources like transactional databases, flat files, or cloud applications. The data is also updated regularly to make informed decisions on time.
- A staging area is a separate database that is used to consolidate records from different sources, clean data, and precalculate aggregates before loading it into the data warehouse.
- A Dimensional model is needed for efficient processing in a SQL Server data warehouse.
- A fact table contains facts (measures) about a business process and is at the center of the schema. There can be multiple fact tables in the SQL Server data warehouse.
- Dimensions categorize the facts and measures in a fact table. They allow you to answer business questions.
- A measure is a property of a fact table that allows calculations.
- The star schema is the simplest dimensional model. It has a fact table at the center and dimensions surrounding it. In a star schema, dimension tables do not reference other dimensional tables.
- The snowflake schema is another dimensional model in which dimension tables can reference other dimension tables.
- SQL Server is a good option for establishing a data warehouse because it integrates with existing ecosystems, offers scalability and performance, and provides security and compliance.
- Building a SQL Server data warehouse involves gathering business requirements, creating the data warehouse (database, fact/dimension tables), extracting/loading data via ETL (e.g., SSIS, Skyvia), and building sample reports (e.g., Excel, Power BI).
FAQ for Data Warehouse from SQL Server

Do ETL tools simplify the process of loading data into a data warehouse?
Yes, ETL (Extract, Transform, Load) tools do simplify data integration. They help clean, map, and load everything into the data warehouse while maintaining data quality and consistency. You can try Skyvia as your ETL tool for free.
Are there any options to try SQL Server for free?
Yes, you can experiment with the Community Edition of SQL Server. You can visit the SQL Server Downloads page to get an installer for your computer.
Can I scale my warehouse if needed?
Yes, SQL Server is designed to be scaled. You can handle data from small setups to large enterprise environments without compromising performance.