")
In a world drowning in data but starving for wisdom, somewhere in a glass tower, a financial data analyst is hunched over their triple-monitor setup. They are parsing through CSV files that could choke an elephant to find patterns that hide insights.
What do disparate records whisper to them? What tools and techniques do analysts use to assemble financial puzzles? And how does everything they do impact businesses?
This guide will walk you through everything you need to know about financial data analytics, including:
- Technical foundations and frameworks that power modern analysis.
- Real-world case studies where companies have transformed their bottom lines with smart data strategies.
Table of Contents
- Demystifying Financial Data Analytics
- The Business Impact of Financial Data Analytics
- A Practical Framework for Financial Analytics
- Putting Financial Data Analytics into Action: Use Cases and Case Studies
- Navigating the Roadblocks to Success
- Leveling the Playing Field: Financial Analytics for Small Businesses
- Building Your Toolkit: How to Choose and Budget for Analytics Tools
- A Question of Trust: Ethical Use of Financial Data
- Conclusion
Demystifying Financial Data Analytics
It is the process of digging into companies’ financial and operational data and compiling that information into reports to make smarter business decisions. Instead of waiting for quarterly reports to tell you what already happened, financial analytics lets you peek around the corner and see what is happening right now.
Behind all of these are analysts – early whistleblowers for financial storms, the compass for strategic navigation, and occasionally, the voice of reason that saves the company’s budget. Their toolkit includes familiar Excel alongside AI solutions that detect unusual patterns and an impressive arsenal of skills: financial modeling, SQL, statistical and mathematical skills, risk management, investment analysis, etc.
Right now, financial analytics, like any other industry in the world, is going through changes triggered and inspired by AI and its possibilities. Some of them continue to shape what analytics looks like. Here are some of the trendiest ones:
- Real-time analytics. Instant insights on market trends, transactions, and performance open the door to better services, and as a result, better revenue.
- AI and Machine Learning. Faster, more accurate risk management, asset management, and financial reporting are indispensable for competitive advantage in today’s markets.
- Augmented analytics. AI becomes a reliable partner for financial analytics and combines efforts to give results that, not so long ago, were only bold dreams.
- Cloud-native analytics. It facilitates collaborative and unified data views across organizations.
Data Integration: The Foundation of Financial Analytics
Stop for a minute and try to count how many sources you’re already working with (according to the IDG report, enterprises use up to 400 sources). Probably, the list will include accounting systems, ERPs, databases, cloud platforms, and spreadsheets. Yes, financial data can live across all of them and more. Entering and working with each separately means nothing will ever be ready on time, but everyone will suffer exasperation. But here comes data integration, the savior of the analytical department. It involves:

All those sources are like tributaries; they meet to turn into a bank-full river. Managing so many streams becomes a bit easier with data lakes, data warehouses, and data lakehouses. They centralize the data that you need for analytics:
Data warehouses (DWH) store structured, cleaned, and processed data optimized for compliance and reporting, which makes them perfect for:
- Historical analysis, financial reporting, and compliance purposes.
- Business intelligence and KPI tracking.
- Risk assessment, credit risk evaluation, regulatory reporting, and financial forecasting.
Date lakes store raw, unstructured, semi-structured, and structured data at scale, which makes them perfectly suitable for:
- Real-time data ingestion and processing for faster decision-making in volatile financial markets.
- Advanced analytics, machine learning, and AI applications.
- Real-time fraud detection, risk monitoring, and dynamic forecasting.
Data lakehouse stores structured, semi-structured, and unstructured data in a single system, so it is great for:
- Advanced analytics, machine learning, AI, and dynamic operational reporting on a unified data set.
- Creating a single source of truth.
- Saving on storage.
- Blending real-time data ingestion and batch processing.
With these three, you don’t have to choose. Many financial organizations combine the real-time monitoring, exploratory analysis, and predictive modeling capabilities of data lakes with the structured financial analysis and regulatory compliance capabilities of DWHs. Alternatively, they opt for lakehouses to achieve the best of both worlds.
Business Intelligence (BI) and Data Visualization
Raw financial data isn’t easy to digest; on top of that, it has to be perceived from various points to reveal all the secrets. BI platforms provide personalized dashboards tailored to what each viewer wants to see.
Smart visualization transforms numerical chaos into:

The Human Element: The Role of the Financial Analyst
Although all this technological wizardry sounds incredible, humans’ role remains as important as ever. They are part detective, part fortune teller, part diplomat with an unhealthy relationship with spreadsheets and dashboards, who bring irreplaceable context:

The Business Impact of Financial Data Analytics
Financial data analytics is what stands between coffee-fueled, chaotic brainstorming sessions and easy-going, market-responsive decision-making. Let’s take a closer look at this wall between chaos and optimization.

1. Drive Informed, Strategic Decision-Making
Instead of relying on gut feelings (that might be influenced by last night’s dinner), thanks to financial analysts, executives can use a 360-degree view of their business operations, complete with trend identification and predictive modeling to:
- Spot market opportunities before competitors even know they exist.
- Respond to changes proactively rather than trying to adapt somehow after the fact.
- Build strategies on solid data instead of wishful thinking and market rumors.
- Navigate volatile markets with the confidence of having actual intelligence rather than flying blind.
2. Enhance Profitability and Revenue
The ability to predict financial outcomes opens the door to other amazing opportunities:
- Calibrate pricing to market gravity instead of guessing at customer spending patterns.
- Identify your most profitable customers. Prepare to be surprised, they’re usually hiding in unexpected segments.
- Sculpt your offerings to focus on winners and phase out the financial vampires.
- Target resources strategically instead of spreading them thinly across every department.
3. Proactive Risk Management and Fraud Detection
Risk management as we know it now is more like fastening a seatbelt, but you’ve crashed a few minutes before. Financial analytics helps you buckle up before you start by:
- Forecasting market risks before the ground begins shaking under your feet.
- Exposing fraudulent patterns in seemingly innocent transactions
- Identifying operational threats that reject your carefully planned initiatives.
- Maintaining compliance with regulations that reshape themselves faster than urban development.
4. Improve Operational Efficiency and Reduce Costs
You might not see financial inefficiencies because they are skilled at masking. Yet, if something does not work as you expected regularly, you may need a flashlight of financial analytics to expose its costly spots. This tool will help with:
- Optimizing supply chains to put an end (or at least significantly reduce) to waste and unnecessary costs.
- Smoothing processes that have grown bloated over time and drain resources without contributing a thing.
- Smart resource allocation that puts money and people where they’ll have maximum impact.
5. More Accurate Budgeting and Forecasting
Learning from the past is what analytics offers. Forecasting the future is what analysts can do when they have reliable data conveniently accessible. As a result, they deliver:
- Reliable budget projections based on actual data patterns rather than optimistic assumptions.
- Quick adjustments when market conditions shift unexpectedly.
- Scenario planning that prepares you for multiple potential futures.
- Financial stability through better planning and resource management.
6. Strengthen Investor Relations and Regulatory Compliance
Who wouldn’t like transparency, especially investors and regulators? Though they have one more thing in common – both hate surprises. Financial analytics helps to deliver the first one and reduce the second one. Strong analytics support:
- Bespoke communications composed to match each stakeholder’s information rhythm.
- Polished compliance documentation that makes auditors smile instead of reaching for their red pens.
- Proactive risk monitoring that prevents minor issues from becoming regulatory nightmares.
A Practical Framework for Financial Analytics
Financial analytics isn’t monolithic, even if we’re talking about small to medium businesses; it has levels where each one is built on the previous one. Most companies start at the bottom and work their way up, though ambitious organizations occasionally try to skip ahead and land face-first in the complexity crater. Here’s how the progression works when done right.

Now, let’s answer each question.
Descriptive Analytics: “What Happened?”
Descriptive analytics is the foundation floor of an analytical skyscraper, the place where raw numbers get their first makeover into something that won’t make executives’ eyes glaze over during presentations. That is your standard financial reporting, dressed up with KPIs and dashboards that transform spreadsheet chaos into digestible insights.
At this stage, you’re essentially building a financial rearview mirror that’s worth looking at:
- Standard financial statements that tell the story of what your money did last quarter.
- Key performance indicators (KPIs) that work like a compass pointing toward magnetic north while showing if you’re wandering in circles or making real progress.
- Historical trend analysis that shows patterns over time instead of random number soup.
Diagnostic Analytics: “Why Did It Happen?”
Once you know what happened, the natural next question is “Why?” Many “obvious” business assumptions go to die here. Diagnostic analytics is where you put on your detective hat and start drilling down into the data like a financial archaeologist, uncovering the root causes of performance mysteries.
This level transforms you from a passive observer into an active investigator:
- Root cause analysis that locates where issues begin instead of simply managing their visible consequences.
- Correlation studies that separate real drivers from coincidental patterns in your critical measures.
- Drill-down capabilities that scale from strategic summaries to operational details on demand.
- Comparative analysis that quantifies differences between customer types, reporting periods, or strategic options.
The tools here get more sophisticated; you’re upgrading from a magnifying glass to a microscope, beyond basic reporting into statistical analysis and data mining techniques that can spot patterns humans might miss.
Predictive Analytics: “What Will Happen?”
Now we’re getting into the fun stuff. Predictive analytics takes your historical data and uses it to peer into the future with statistical models and machine learning impressions. That is where financial planning stops being wishful thinking and begins to resemble actual science.
The predictive arsenal includes:
- Sales forecasting models that predict revenue based on historical patterns, seasonal trends, and market indicators.
- Cash flow projections that help you avoid the embarrassing situation of running out of money during growth spurts.
- Market trend analysis that spots shifts before your competitors figure out which way the wind is blowing.
- Risk modeling that quantifies the probability and impact of various threat scenarios.
Machine learning algorithms can consume large-scale datasets and detect interdependencies that would otherwise require human experts to engage in prolonged research cycles. However, that doesn’t mean they can replace them fully tomorrow. It only means that now analysts have more time for other important tasks.
Prescriptive Analytics: “What Should We Do?”
Information is most useful when it goes from prediction to prescription. This stage provides ongoing strategic advice, keeps the full picture of the data in mind, and gives:
- Resource optimization determines the ideal distribution across conflicting demands.
- Strategic simulation evaluates different approaches under varying market scenarios.
- Intelligent recommendations that propose specific steps based on emerging data trends.
- Real-time plan recalibration that modifies strategies as circumstances change.
Important constraint: The most successful organizations use prescriptive analytics to inform human judgment rather than replace it. That is a powerful mix of analytical accuracy and strategic wisdom.
Putting Financial Data Analytics into Action: Use Cases and Case Studies
Financial analytics sounds impressive in boardroom presentations, but the real question is: how does it work in the messy, complicated world of running a business? Here are some real-world applications that prove analytics isn’t just an academic exercise; it’s the difference between guessing your way to success and making it happen.
Use Case: Financial Planning and Analysis (FP&A)
FP&A represents the arena where financial analytics demonstrates its full potential. Instead of treating budgets like wishful thinking documents that bear no resemblance to reality, analytics-powered FP&A transforms planning into a precision instrument.
Variance analysis in modern FP&A uses analytics to dig deeper than simply stating, “Oops, we spent more than we planned,” especially when it becomes “Oops, we did it again.” It identifies patterns, seasonal effects, and underlying drivers that explain why variances happen.
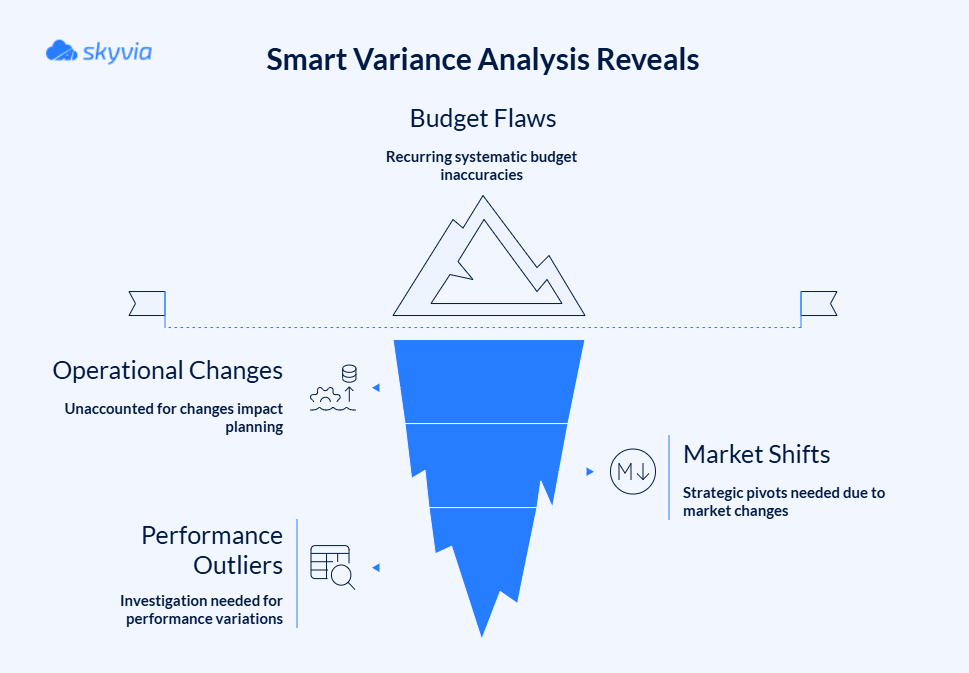
Rather than building one budget and praying it works out, analytics-driven scenario planning creates multiple potential futures and tests a strategy against all of them. That flight simulator examines best-case scenarios, worst-case scenarios, most-likely scenarios, and, of course, black swan events.
Use Case: Profitability Analysis
Profitability analysis is where many companies finally look in the mirror and discover uncomfortable truths about their business. What looks profitable on the surface often turns out to be a revenue thief. Analytics-powered profitability analysis cuts through these illusions by:

It’s important to understand that the main goal isn’t just to learn which activities make money, but also to know why they make money and how to replicate or improve these conditions across the business.
Case Study 1: Retail Company Boosts Profitability
The Problem: In 2022-2023, Walmart found itself in the midst of an unequal battle with fluctuating consumer demand, inflationary pressures, and supply chain disruptions. Store operators remained inflexible when local conditions changed, and corporate leadership struggled to predict how salary changes or supply cost fluctuations would impact broader operations.
The Solution: Walmart adopted a driver-focused financial prediction model that directly linked operational metrics to fiscal performance. They established clear relationships between specific business activities and quantifiable financial impacts.
The transformation involved several key innovations: operational mapping connecting store metrics to financial predictions, automated modeling cascading transaction changes across regions, unified planning linking departments via shared monthly updates, and interactive tools letting executives test economic impacts instantly.
The Result: Within one fiscal year, Walmart achieved 22% faster planning cycles, forecast accuracy improved from 85% to 94% in core categories, $1.1 billion in operational savings, and enhanced capital deployment.
Case Study 2: Tech Startup Secures Funding with Accurate Forecasting
The Problem: An AI-powered healthcare SaaS obtained substantial investments due to its innovative system that accelerated clinical trial participant identification from the conventional 18-month cycle to mere weeks. Despite that, the organization was burning capital at an unsustainable rate with unclear origins.
The Solution: The company brought in financial analytics experts who immediately diagnosed the core problem: their accounting system was set up like a traditional business rather than a SaaS company, making it impossible to track the metrics that mattered for their business model.
The transformation involved several critical steps: financial data restructuring, advanced financial modeling, KPI dashboard development, and predictive analytics integration.
The Result: The change generated demonstrable outcomes spanning multiple operational categories: revenue doubled within one year, ARR became the dominant revenue component, cash runway extended from 6-12 months to 18 months, and marketing ROI optimization.
Case Study 3: Data Integration as Foundation for Sharp Financial Analytics
These use cases show how financial analytics helps teams gain the ability to look and move freely into the future. Though we would like to present one more use case that illustrates preparation that makes this possible – how data integration sets the stage for analytics.
The Challenge: NISO, an outsourced CFO company serving the merchant cash advance (MCA) industry, faced a significant data integration bottleneck. They used manual scripts to extract data from MySQL to Excel spreadsheets and then push it into QuickBooks Online. The company scaled up, but the approach couldn’t. The team needed to paint a broader financial picture for clients but lacked the infrastructure to pull together data sources.
The Solution: Skyvia emerged as the missing piece of NISO’s data puzzle. Rather than developing custom APIs from scratch, the company used out-of-the-box MySQL and QuickBooks Online connectors.
The Result: Data engineers now move through projects at lightning speed, while support teams have adopted the platform for documentation workflows. NISO successfully consolidated customer information across multiple touchpoints, enabling the scalable financial analytics their clients demanded.
Navigating the Roadblocks to Success
Welcome to the unglamorous world of analytics implementation, where good intentions meet stubborn technology and human nature. The universal rule of theory and practice is that the first one always seems friendly and easy, but the second one has a wicked sense of humor.
Challenge 1: Data Silos and Poor Data Quality
Data silos are a bizarre workplace sitcom, where each department operates in parallel dimensions that occasionally intersect. And every time you bump, there should be the audience’s laughter in the background, but instead, there are only revenue losses and a myriad of different facts that compete with each other.
Poor data quality amplifies the silo problem exponentially. When your database contains different entries for the same piece of information, everyone throws up their hands in confusion, even the tools.
Solution: Create a Single Source of Truth
 Is Built")
The answer lies in data integration platforms like Skyvia that act like universal translators for your business systems. These systems transcend basic data transfer by performing critical transformation work: they normalize messy inputs, resolve conflicts between sources, and construct a single, trustworthy data environment that teams can depend on.
What to look for when choosing a data integration platform to support financial analytics?
- Automated data cleansing that spots and repairs messy information without needing your attention.
- Transformation and mapping (filtering, sorting, aggregation, lookups, and expression-based mappings) to directly address poor data quality during integration.
- A vast amount of pre-built connectors or the ability to connect sources and targets on your terms.
- Data integration (ETL/ELT) between cloud applications, databases, data warehouses, and flat files to allow you to connect and transfer everything from everywhere.
- Real-time synchronization and monitoring that keeps all systems updated simultaneously.
- Data workflows automation and scheduling, helping maintain continuous data integration and timely updates necessary for reliable financial analytics.
- Data lineage tracking that shows where information originates and how it flows through your organization.
- Also, a user-friendly, no-coding-required interface will be a nice addition too. It allows finance and business teams to manage data integration processes, improving accessibility and reducing bottlenecks caused by siloed specialist knowledge.
Challenge 2: Lack of In-House Expertise
Machine learning algorithms and statistical modeling normally aren’t a part of a finance team’s expertise. How can you solve that? Probably, the first thing that comes to your mind is hiring expensive data scientists. However, sometimes it creates new problems if you’re not planning to keep them on a team as long as the team exists.
These specialists often build sophisticated models that are beyond the perception of others. When they leave, they take their analytical capabilities with them, and finance teams find themselves even more puzzled than before.
Solution: Make analytics accessible with user-friendly tools
When people won’t climb the learning curve, flatten the curve for them – bring analytics tools down to their level of technical comfort. Modern low-code and no-code platforms let finance professionals build sophisticated analyses using familiar concepts like drag-and-drop interfaces and Excel-style formulas. With Skyvia’s no-code approach, you can also “flatten” the first step – data integration, making the whole path smoother.
These counterbalancing analytics tools help to strengthen your current finance staff, not substitute them with someone else, by offering:
- Visual query builders that let users create complex analyses without writing SQL code.
- Ready-made financial templates for standard tasks like analyzing budget differences and modeling profit scenarios.
- Self-building predictive analytics that creates forecasting models based on business goals instead of technical requirements.
- Conversational query systems that respond to everyday language questions with actionable insights.
Challenge 3: Moving from Passive Reporting to Real-Time Insights
Standard financial reporting is retrospectively informative but strategically useless. Month-end closes consume weeks while business conditions evolve, leaving finance teams capable of explaining past failures but unable to prevent current problems.
Reporting cycles work like time-consuming quicksand. Research indicates that analysts invest 80% of their time in data collection and formatting, leaving only 20% for analysis and business insights. Like that, those who are supposed to be strategic partners become data housekeepers.
Solution: Automate your pipelines for real-time analytics
Better a steady stream than a monthly flood. Flowing water stays fresh while standing pools grow stagnant. We can continue with these analytics “proverbs,” but the statistics are even more canting. Over 90% workers report increased efficiency, and 85% see improved team collaboration when they embraced automation. Nearly 90% trust these tools to reduce errors and accelerate decision-making.
Essential capabilities that help to create an analytics environment where insights are available when decisions need to be made include:
- Automated data pipelines that move and process information constantly, rather than in periodic bulk operations.
- Alert systems that issue alerts when vital metrics cross predefined limits.
- Real-time dashboards that reflect changes immediately as business activities happen instead of waiting for period-end processing.
- Self-service analytics to explore data without waiting for help.
Let’s summarize now. The companies that faced these challenges and won aren’t those with the biggest budgets and smartest data scientists, but those that had practical strategies to storm them. Start by automating pipelines using Skyvia, and build the rest brick by brick using accessible BI tools, which we’ll discuss in a minute or two.
Leveling the Playing Field: Financial Analytics for Small Businesses
Small and medium businesses need smart financial insights just as desperately as Fortune 500 companies with deep pockets and armies of data scientists, arguably more so. They can’t afford to make expensive mistakes or miss profit opportunities. The challenge is making enterprise-grade analytics accessible to smaller companies.
Here’s the good news: the democratization of analytics technology has created opportunities for SMBs to compete with much larger organizations, provided they’re smart about their approach and realistic about their resources.
The SMB Challenge: Limited Budgets and Expertise
Small companies often fight overlapping issues where implementing conventional analytics tools proves to be through the roof. Enterprise-class solutions may provide sophisticated features, but their price tags hurt. When an entire annual budget wouldn’t cover a month of licensing, those slick platforms start looking like expensive toys rather than business necessities.
The equation goes on – add in implementation costs, training expenses, and ongoing maintenance fees. So, SMBs need solutions that work with existing teams and budgets rather than requiring new hires with advanced degrees in data science.
Small businesses also face practical limitations that larger organizations don’t even notice:
- Limited IT infrastructure that can’t support complex data warehousing solutions.
- Manual processes that create data quality issues and integration challenges.
- Time constraints where analytics projects compete with daily operational demands.
- Risk aversion makes expensive technology experiments financially dangerous.
So far, the picture for SMBs looks quite gloomy and dull, even a bit medieval. However, there are some advantages inaccessible to enterprises:
- They’re typically more agile.
- Can implement changes quickly.
- Often have clearer visibility into their core business drivers.
The trick is using these strengths while working around the resource constraints.
Cost-Effective Solutions for SMBs
You can try to compete with enterprise budgets. Yet, you also can assemble powerful analytics capabilities using combinations of freemium tools, scalable platforms, and focused implementations that deliver disproportionate value. Which one sounds like you?
That is the concept for SMBs to turn what seems like a pure disadvantage into something that multiplies profit and makes teams stronger. Now, let’s take a look at the details.
Freemium BI Tools for Financial Analytics

The financial analytics software market would impress you. It’s a kaleidoscope of tools for all types of tasks. But let’s talk about those that can become your gateway.
Google Looker Studio and Microsoft Power BI’s free tier represent the revolution in business intelligence. You get genuinely powerful data visualization and reporting capabilities with zero upfront costs:
- Power BI’s free tier includes robust data modeling capabilities and can connect to multiple data sources.
- Looker Studio excels at creating shareable reports and dashboards that automatically update.
Both platforms offer different upgrade paths when your needs outgrow the free versions, creating natural scaling opportunities.
| Product | Pricing Tier | Cost | Key Features |
|---|---|---|---|
| Power BI | Free | Free | Power BI Desktop, limited sharing capabilities |
| Power BI Pro | $10 per user/month | Sharing and collaboration within an organization | |
| Power BI Premium per User | $20 per user/month | Advanced analytics and enhanced features | |
| Power BI Premium per Capacity | $4,995 per month | Unlimited users, enterprise-grade capabilities | |
| Looker Studio | Free | Free | Self-service BI, report creation, and viewers |
| Looker Studio Pro | $9 per user/project/month | Advanced BI features, Google Cloud support, admin tools | |
| Looker Platform Editions | Custom quote | Enterprise-focused, various editions, and API limits |
In general, financial analytics software ranges from free (Google Looker Studio) to affordable SMB subscriptions ($10–$30/user/month for Power BI), all the way to enterprise BI and data integration suites that can cost hundreds of dollars per user monthly, depending on scale and features.
Also, let us take a little step aside and mention the best tools for real-time financial analytics, as this is a trend with huge potential. This list includes:
- Xero – real-time P&L (profit and loss), cash flow, and balance sheet reporting range from $35 to $272 per month, depending on features and number of users.
- Sage Accounting – real-time, multi-entity financial reporting with customizable dashboards that start at approximately $9,000 annually for two users and two business entities.
- Exact Online – real-time financial insights directly within its platform through dashboards and reports start at $315 per month for a basic Small Business plan (up to three users).
Scalable Data Integration: Pay for What You Use
Many SMB analytics efforts miss one crucial piece – getting data from disparate systems into a format that BI tools can work with. That is where scalable, pay-as-you-go integration platforms can lend you a hand.
Tools like Skyvia, a universal cloud data platform designed for a wide set of data-related tasks, operate on pricing models that align costs with actual usage rather than demanding upfront commitments for capabilities you might never need. This approach offers several advantages:
- Start small and scale gradually without massive initial investments
- Pay only for data volumes you process, rather than theoretical capacity
- Eliminate expensive IT consulting for custom integration projects
- Reduce manual data entry that consumes valuable staff time
Skyvia contains five principal products: Data Integration, Query, Connect, Automation, and Backup.

The Data Integration product, in particular, has everything needed to gather and transform data, making it analysis-ready. Data Integration comprises the following features:
- Import is an ETL-based tool for migrating data between cloud applications, databases, and data warehouses. It allows users to apply transformations on data, such as lookups and expressions, and perform mapping to match data structures.
- Export extracts data from cloud apps into CSV files that can be saved on a computer or cloud storage.
- Replication is the ELT-based tool for copying data from cloud apps into data warehouses and databases. It uses the CDC approach to capture data differences when making incremental updates on schedule.
- Synchronization performs the bi-directional data sync between two sources. It also uses the CDC to identify which data was changed in one source and make the appropriate changes in another.
- Data Flow allows users to build more complex data pipelines, including several sources, and apply multistage data transformations. This tool also supports error processing logic.
- Control Flow creates logic for task execution, performs preparatory and post-integration activities, and configures automatic error processing logic.
Take a look at how a Skyvia user has successfully set up the Salesforce to QuickBooks integration, which streamlined their financial reporting.
Sales Reconciliation: Money You Didn’t Know You Had
Matching orders, payments, and inventory across different systems makes many small businesses feel uncomfortable. If they don’t consider them sacred and don’t attend to them religiously, the results are intimidating – hidden revenue leaks, customer service issues, and complicated tax reporting. Automated reconciliation analytics can:
- Identify missing payments that might otherwise go unnoticed for months.
- Spot inventory discrepancies that affect profitability calculations.
- Streamline month-end closing by catching minor issues before they become major problems.
- Improve cash flow forecasting through better visibility into payment patterns.
Expense Tracking: Death by a Thousand Cuts
Expense creep is yet another thing SMBs often suffer. Consolidated expense analytics can reveal patterns that individual transactions don’t show:
- Subscription proliferation, where multiple departments sign up for similar services.
- Vendor pricing inconsistencies that create opportunities for negotiation.
- Seasonal spending patterns help with budget planning and cash flow management.
- Category-level trends that highlight areas for cost optimization.
Building Your Toolkit: How to Choose and Budget for Analytics Tools
The analytics marketplace is flooded with options that range from free tools with surprising capabilities to enterprise platforms that cost more than some people’s annual salary. The trick is building a toolkit that delivers real value without leaving the company penniless or overwhelming your team with complexity they can’t handle.
Buy too much too soon, and you’ll have expensive gadgets gathering dust. Choose the wrong tools for your needs, and you’ll spend more time fighting with technology than generating insights.
Key Factors to Consider (Scalability, Ease of Use, etc.)
To select the proper tool for analyzing financial data in your organization, it makes sense to consider a number of factors.

- Business goals and data needs. Companies that aim to get instant insights about financial performance should implement real-time analytics tools. If occasional and non-urgent reports are fine, then batch-processing tools would work fine.
- Scalability and flexibility. Explore whether a tool of interest has limits on the data volumes. See how these numbers correlate with your expected data load and decide whether this tool is flexible and scalable enough for you.
- Ease of use. Pay attention to the user interface and the overall complexity of the analytics service. If it’s too complex, be prepared to spend some time mastering your skills.
- Integration with other finance data sources. See how the analytics tool connects to other sources where your financial data is stored. Consider using data integration tools that support both the analytics service of your interest and apps containing financial data.
- Cost and budget. Decide whether a specific analytics tool aligns with your budget. Pricing details are provided on each tool’s official website.
- Advanced analytics and machine learning. Check if the selected solution has these features if you require them (now or in the future).
- Security and compliance. It is especially important to make sure that an analytics tool complies with current security standards and protocols.
- Community and support. Verify whether the recommended solution offers community forums and customer support to address your questions throughout the implementation and subsequent phases of use.
Understanding Pricing Models: A Cost Comparison
Analytics pricing models twist themselves into pretzels, where no heads and tails can be made. Let’s see what riddles may await while choosing the needed tools, so you can get past flashy headline numbers to dig into what you’ll shell out over time.
| Pricing Model | Predictability | Scalability | Best Use Case |
|---|---|---|---|
| Per-User/Month | High | Moderate | Stable teams with consistent usage |
| Consumption-Based | Low | High | Variable workloads, seasonal businesses |
| Tiered | Moderate | High | Growing organizations with evolving needs |
| Fixed | High | Low | Predictable usage, budget-constrained environments |
- Per-User/Per-Month: Classic of all Classics
This model charges a fixed monthly fee for each user who accesses the platform. On one side, it’s predictable and easy to budget, but on the other, costs can escalate quickly as teams start to grow.

- Consumption-Based: Pay for What You Use
These models charge based on the amount of data processed, the number of queries executed, or the amount of storage consumed. Just like the previous model, this one can be unpredictable during growth phases.

- Tiered Pricing: Feature Graduation
Most tools offer multiple tiers with increasing capabilities and costs. Basic tiers handle fundamental needs while premium tiers unlock advanced features.

Skyvia vs. Other Data Integration Tools: A Feature Comparison
When you need to consolidate data from disparate systems into a unified format, the integration platform you choose can predefine all the subsequent operations. Here’s how leading options stack up across the factors that matter for business success.
| Feature | Skyvia | Fivetran | Stitchdata |
|---|---|---|---|
| ETL vs. ELT Capabilities | Supports both ETL and ELT, plus data backup | Primarily ELT-focused | Primarily ETL-focused |
| No-Code Interface | User-friendly, no-code setup ideal for non-technical teams | Minimal UI with a hands-off automation approach | Drag-and-drop interface |
| Transformation Capabilities | Graphical and SQL-based, bidirectional synchronization, data splitting, and conditional logic capabilities | Handles nested data normalization and complex transformations | Supports transformations but may need external tools |
| Pricing Model | Usage-based, affordable for SMBs. The freemium model allows to start with the free plan. | Usage-based, higher-priced due to extensive feature set | Subscription and usage-based, competitively priced |
| G2 Rating | 4.8/5 (praised for ease of use and versatility) | 4.2/5 (high marks for automation and reliability) | 4.4/5 (good usability and customer support) |
Skyvia gives power over data without the pain. It combines ETL, ELT, and backup services into one package, which means fewer vendor relationships and login problems. With the point-and-click method, finance folks can make what they need without having to send every request through the busy IT department.
A Question of Trust: Ethical Use of Financial Data
Trust forms the load-bearing wall of financial analytics. Remove it and watch everything collapse in spectacular fashion. A single rogue algorithm or opaque decision can flip your company from a success story to a regulatory nightmare. The winners? Those boring companies that read the ethics manual instead of using it as a doorstop.
Data Privacy and Security
Today’s regulations demand crystal-clear consent mechanisms that are understandable to humans. You wouldn’t show up to someone’s house uninvited and start rummaging through their fridge, would you? The same courtesy applies to customer data. Financial institutions now need explicit, granular consent for every piece of data they collect, not some vague “we might use your data for stuff.”
The penalties for getting this wrong? Eye-watering. We’re talking GDPR fines that can reach 6% of global revenue. Let’s see what you can do to avoid fines:
- Build digital fortresses with multiple layers of protection that make even thinking about accessing your data too exhausting and exasperating. AES-256 encryption should be your data’s best friend, both when it’s lounging around in storage (at rest) and when it’s traveling across networks (in transit).
- Access controls follow the “need-to-know” principle, which is the financial world’s version of “mind your own business.” Role-based access control (RBAC) ensures no one can peek into someone’s credit risk models. Multi-factor authentication adds another layer because in a world where “qwerty123” still exists, we need all the help we can get.
- Anonymization techniques – witness protection program, but for data points – transform recognizable data into something that couldn’t identify a person if it tried. Pseudonymization, data masking, and differential privacy let you analyze patterns without exposing individual identities.
- The final weapon is data minimization. Collect only what you need. Less data means less exposure, and less exposure means fewer sleepless nights when the security team sends those dreaded “urgent” emails.
Avoiding Algorithmic Bias
Your historical data might be carrying more baggage than you suspect, and all of it pulling invisible strings of algorithmic bias. Fighting a vicious cycle of discrimination, especially in credit scoring or client risk assessment, requires a multi-pronged approach:
- Create interdisciplinary teams pairing technical minds, including ethicists and social scientists. While a homogeneous team might build an algorithm that works perfectly for people who look and think like them, diverse teams are an early warning system.
- Technical solutions matter too. Activate automated fairness scanners, prejudice-resistant algorithms, and perpetual model surveillance to help identify and eliminate discrimination before it spreads.
Transparency and Accountability
When your code decides who gets loans and who gets rejected, “it’s complicated” stops being an acceptable answer. Transparency and owning your outcomes separate the pros from the charlatans peddling fancy math with zero accountability.
- GAAP and IFRS are surely bureaucratic paperwork, but it’s more beneficial to also look at them as the guardrails that prevent analytics from turning into creative fiction. When a fraud detection model feeds into financial reports, stakeholders deserve consistent, accurate information that means the same thing in Mumbai or Manhattan.
- When algorithms malfunction, someone with a human heartbeat needs to own the problem. And there’s no point in blaming a machine for what it did because you taught it.
- Avoiding scandals is definitely a win. But here’s an even bigger prize. By aligning data practices with Corporate Social Responsibility, you build reputational assets that attract customers, partners, and talent who vote with their wallets for responsible data handling.
Being the organization that gets ethics right isn’t just morally satisfying, it’s strategically brilliant. Because at the end of the day, trust is the most valuable currency in finance.
Conclusion
The what in financial analytics is clear: transform raw data into predictive intelligence. The why is undeniable: companies using smart analytics demolish their gut-feeling competitors. The how spans freemium tools to enterprise platforms, all connected by integration systems that turn data chaos into competitive advantage.
But we’re just scratching the surface. AI and machine learning are reshaping finance faster than regulations can keep up. The future of AI automation belongs to organizations that have developed a powerful foundation of tools and approaches that can seemingly blend with tomorrow’s innovations.
Ready to lay the first stone with reliable data integration? Whether you’re bootstrapping or scaling, smart financial analytics starts with unified data. Skyvia’s 200+ connectors and flexible pricing turn scattered information into strategic gold.
FAQ for Financial Data Analytics

What is the difference between financial data analytics and data analytics?
Data analysis is an umbrella term used across various sectors of the economy. Financial data analysis is focused on invoices, payments, budgeting, and other operations related to corporate finance. It helps businesses make informed decisions and develop weighted investment strategies.
What are the data sources for financial analysis?
There are many different sources of financial data, though there are several most important ones. Those are cash flow statements, income statements, and a balance sheet.