SQL Server Data warehouse? Sounds boring. Who would want to learn this? But what if we tell you that data analysis tops every “most valuable skills” list for a reason, and SQL in a data warehouse is right at the heart of it.
They form the backbone of modern analytics, and SQL is the universal language that lets you interact with that data. These acronyms and concepts don’t exist for complexity’s sake; instead, they are necessary because trying to run meaningful analysis on scattered, inconsistent data sources is where even the most promising projects get lost.
This article will walk you through the essentials, whether you want to optimize queries, merge sources, or just grasp the basics. And don’t worry if you’re new to SQL – this guide is designed for everyone. You can follow along on your PC by downloading and installing the free SQL Server Community Edition.
Table of contents
- What is a Data Warehouse?
- Advantages of DWH SQL Server
- How to Build a SQL Server Data Warehouse
- ETL Tools for Data Warehousing
- How to Automate Cloud-to-SQL Server ELT with Skyvia
- Conclusion
What is a Data Warehouse?
A data warehouse (DWH) is the central repository of information for analysis, artificial intelligence, and machine learning. To make the warehouse efficient, data is loaded from different sources, like transactional databases, flat files, or cloud storage, and should be regularly updated.
The illustration for a typical DWH environment is shown below.

The first part of the diagram is the sources of data. These are databases from transactional systems. It can be in SQL Server or another relational database. It can also be from flat files like CSVs, Excel, XML, and text.
Afterward, you consolidate all the necessary records from the source into a single format, known as the staging area. For simplicity, you can also implement the staging area in SQL Server.
Then comes the data warehouse SQL Server with a dimensional model. We will discuss how to make one with an example later.
The SQL Server data warehouse appears next, organized through a dimensional model. Why does this matter? Your queries run faster. Analysis becomes something you can finish before lunch instead of fighting through messy table relationships.
Data marts close out the architecture. Think of them as departmental views, with separate focus areas for sales operations, purchasing workflows, or customer analytics.
Data moves between these directions thanks to ETL, ELT, or reverse ETL:
| Aspect | ETL | ELT | Reverse ETL |
|---|---|---|---|
| Data Flow | Source → Transform → SQL Server | Source → SQL Server → Transform | SQL Server → Business Apps |
| Transformation | Before loading | Inside SQL Server after loading | Mostly format/mapping for apps |
| Volume & Timing | Often batch, scheduled | Scalable, can be near real-time | Frequent, often near real-time |
| Purpose | Clean, unified warehouse data | Flexible, scalable transformations | Operational activation of data |
| Users | Data engineers, analysts | Data engineers, analysts | Business users, sales, and marketing |
In this article, we walk through building a SQL Server data warehouse with a single data mart focused on insurance policy sales, showing how raw data moves from transactional sources through a staging area, gets structured into a dimensional model with fact and dimension tables, and is ultimately transformed into meaningful reports via ETL and ELT processes.
Dimensional Model
Before the data moves into a warehouse, we need to prepare its residence. Data modeling tools define and maintain the DWH schema.
Actual data movements and transformations occur in ETL/ELT workflows that interact with both staging and warehouse areas, but outside of the modeling tool’s direct operation.
Dimensional data modeling is a specific method designed for analytics and data warehousing systems like SQL Server DWHs.
Here are some key terms used in the dimensional model.
FACT TABLE
A fact table contains all the facts about a business entity or process. It’s at the center of the schema, surrounded by dimensions. A fact table may be about sales, ticket support, projects, etc. You can implement this as an SQL database table. Columns include the ID keys of dimensions and measures.
Each record will determine how detailed a fact table is. There can be several fact tables in a DWH, each defining different business processes within the same warehouse. Each of them can share dimensions about location, date, and more.
DIMENSIONS
Dimension categorizes facts and measures in a fact table. For example, the city or region dimension describes a customer’s location in a sales transaction. Other examples of dimensions are customer and product in a sales business.
Dimensions also enable users to answer a business question. For example, “How much did we earn from Product X this month?” In this question, the Product is the dimension of a Sales fact.
Dimension is implemented as a table referenced by the fact table. It includes a primary key and the key description or name, such as a product ID and name. However, more can be defined within a dimension to categorize it and further build a hierarchy. A product doesn’t exist in isolation. Category places it in a general bucket, while a subcategory refines that placement with more precision.
A dimension primary key can diverge from what the source table uses. Combine customer lists from different databases and you’ll see why: duplicate IDs create chaos. Surrogate keys – new, warehouse-specific identifiers – prevent that mess.
MEASURES
The measure is a property of the fact table that allows calculation. That can be sum, average, count, minimum, or maximum. For example, you can sum sales amounts to form total sales.
Measures can be additive, non-additive, semi-additive, or calculated. The sales amount is an additive measure. You can sum or average it. But the unit price is non-additive.
It may not make sense if you sum it up. Meanwhile, a calculated or computed measure is like its name. The total sales amount, for example, is calculated based on product unit price + tax.
Types of Data Warehouse Schema
Your DWH needs a schema, the framework that determines how data sits and connects. Performance matters. So does disk space. Query complexity enters the equation, too. Which schema wins? Whatever aligns with your business priorities and usage patterns.
Let’s review the most common types.
STAR SCHEMA
The simplest and most widely used dimensional model. It has the fact table at the center and the dimensions surrounding it.
It can also be described as a parent-child table design – the fact table is the parent, while the dimensions are the children. But since it’s so simple, there are no grandchildren.
Common characteristics of star schema:
- The fact table is at the center, containing dimension keys (foreign keys) and measures.
- Primary keys in dimension tables are foreign keys in the fact table.
- No dimension table references another dimension table. They are denormalized.
Advantages of star schema:
- Simpler queries because of the simple design.
- Easily maintained.
- Faster access to records because of the denormalized dimension table design.

SNOWFLAKE SCHEMA
It splits dimensions through normalization, creating sub-tables that connect in branching patterns. Sketch one, and the snowflake comparison makes sense immediately.
The relationships nest deeper than simple parent-child; you can have grandchildren tables without the model breaking.
Common characteristics of snowflake schema:
- A fact table is also at the center, like the star schema.
- The fact table references first-level dimension tables.
- A dimension table can reference another dimension table. This design is normalized.
Advantages of snowflake schema:
- More flexible to changes in structure.
- Less storage space is taken because of normalized dimension tables.

Advantages of DWH SQL Server
Choosing the platform is an essential step in building a DWH. SQL Server is an excellent option for many reasons:
- Integration with Existing Ecosystems
SQL Server belongs to Microsoft’s ecosystem, which matters more than it sounds. When Power BI or Excel needs data, the connection just works. Organizations building reports or crafting visualizations face fewer technical obstacles. - Scalability and Performance
Designed to support systems of various sizes, from small setups to enterprise-level data warehouses, it offers features such as partitioning and column store indexes. Faster data processing and improved query performance are substantial benefits. - Cost-Effectiveness
Multiple editions, including a free Community Edition, make this platform accessible to organizations with different budgets without losing core features. - Security and Compliance
Data protection is ensured through encryption, access controls, and auditing capabilities. The platform also complies with industry regulations like GDPR and HIPAA. - Advanced Analytics Integration
Native data science and ML capabilities mean predictive models can live and run inside the database itself. - Rich ETL Features
SQL Server Integration Services (SSIS) makes it easier to handle data extraction, transformation, and loading tasks across diverse sources. - User-Friendly Management
SQL Server Management Studio handles warehouse configuration and upkeep without demanding advanced skills from every user.
How to Build SQL Server Data Warehouse
Time to put the concepts above to practical use. In this example, we will use a fictitious company called ABC Insurance Co. The company sells fire insurance policies for residential houses, apartments, and business structures.
Our DWH example will have these simple characteristics:
- One (1) transactional database.
- The staging area will have a copy of the transactional database for the tables and columns needed.
- The data warehouse will use a star schema focusing on insurance policy sales.
Step 1: Define Business Needs and Prepare the Staging Area
Analysts who skip the “what are we actually trying to solve” conversation end up building dashboards nobody opens.
1. RECEIVE BUSINESS QUESTIONS
Output for this step:
- A list of business questions and their objectives
- Expected answers, including the desired report formats
Stakeholders arrive with questions, often half-formed. Pull those into focus so the analysis you build answers what they’re really asking.
In our example, we only need to answer how many sales were made in a particular period to demonstrate the concepts we have learned.
To get the answers, pay attention to the current state of the system and the desired outcome. Ask for the report formats they need. Then, proceed to the next step.
2. INSPECT THE SOURCE TRANSACTIONAL DATABASE AND CREATE THE STAGING AREA
OutpOutput for this step:
- Staging area database.
- Plan for extracting data from the source to the staging area.
The transactional database contains all the currently available information. For simplicity, we’re assuming the source database has all the necessary data sitting there ready to go. Real life is messier. Missing critical information? Back to the stakeholders, you go to locate the missing pieces. Then, resolve the matter separately. Then, return to this step.
Review the source database and pick only the tables and columns you need. Note any cleaning steps required before moving data to the staging area.
Once you’ve identified all required tables and columns, you’re ready to plan how to move the data into the staging area.

Figure out how data reaches staging. That’s your current assignment. With that handled, the next phase opens up. Before we go there, though, let’s look at why staging exists as its own database.
You may ask, what’s wrong with getting the data straight from the transactional database?
- Our example uses only one database source. In the real world, you don’t just deal with sales. You can have other systems for purchasing, petty cash, payroll, and more.
- If these have separate databases, and you want to analyze them, this staging area may be suitable for them, too.
- Consolidating data from different systems into one staging area will be an advantage. One example of something that they can share is an employee list.
- Another point is data cleansing. You don’t want to touch a working transactional system. So, you clean the data in the staging area.
- Another point is the precalculation of aggregates. Before reaching the DWH, do you need to do some complex calculations or summarization? You can also do that in the staging area.
3. WHERE THE STAGING AREA SHOULD RESIDE
Staging can share your SQL Server data warehouse server or run independently. Each approach trades something – speed for simplicity, isolation for resource efficiency. What tips the scale? Performance requirements, scalability ambitions, and how your infrastructure is built:
Same Server:
- Common for small to medium workloads.
- It is easier to manage and reduces latency between staging and the warehouse.
- It can impact performance if staging jobs consume significant resources.
Separate Server:
- Enterprise workloads with massive data flows benefit most here.
- Staging runs separately, so transformation work doesn’t compete with production queries; each tier scales without affecting the other.
- Specialized cloud storage speeds up the loading and reshaping processes that would otherwise bog everything down.
Hybrid Approaches:
- Use cloud storage or dedicated ETL servers as staging zones.
- Data hits cost-effective, expandable storage first, gets processed there, then moves into SQL Server.
In short: Small-scale? Same-server staging works if you’re vigilant about resource consumption. Larger, messier environments? Go separate – dedicated servers or cloud staging deliver flexibility, cleaner isolation, and performance that doesn’t degrade as complexity grows.
Step 2: Build the SQL Server Data Warehouse
Finally, we have reached the focal point of this article – setting up a new SQL Server database specifically for the DWH.
Output for this step:
- SQL Server database for the data warehouse.
- Plan to populate the data warehouse from the staging area.
To create a new database for DWH, launch SQL Server Management Studio. Then, right-click the Databases folder in the Object Explorer and select New Database. Name your database and set the database options. We named ours as fire_insurance_DW.
1. CREATE THE FACT TABLE
Now, let’s create new tables for the SQL Server. We will start with the fact table. For our fire insurance sales example, we have the structure as shown below.

The fact table above includes three additive measures: premium, other_charges, and total_amount_paid. In the meantime, total_charges is a computed measure based on premium + other_charges.
Please also pay attention to the foreign keys client_id, building_city_id, product_id, and statement_date. They will reference dimension tables later.
2. CREATE THE DIMENSIONS
Next, create the dimension tables. We have product, client, city, and date dimensions. Each serves a purpose in reporting. The table below shows all the dimensions in our data warehouse example.

See each dimension in more detail:
- dimFireInsuranceProducts includes all fire insurance products. This dimension will categorize product-related figures, such as total premium sales by product.
- dimClient includes the list of clients who bought fire insurance policies.
- dimCity includes the list of cities within states. The state information is included, which makes this table denormalized. That defines the location of the property insured. If we made the data warehouse with a snowflake schema, another dimension table for the state should be created.
- dimDate is a date dimension that will filter sales by period. Users can filter from yearly to daily summaries.
Check the final database diagram of our data warehouse below.

Analysis doesn’t end in creating the database for the DWH. So, let’s go on, we still have a lot to do.
Step 3: Extract Data from the Transactional Database into the SQL Server Data Warehouse
This step has some important precautions. Before you extract data, do not forget to create the field mappings from the source and target. Make sure there’s a comfortable space that will perfectly accommodate the data. You can find an example of fact table mappings below.

Building the date dimension requires a small script. This sample creates a dimDate table with every day from 2020 to 2021.
DECLARE @StartDate  date = '01/01/2020';
DECLARE @EndDate date = '12/31/2021';
;WITH seq(n) AS
(
    SELECT 0 UNION ALL SELECT n + 1 FROM seq
    WHERE n < DATEDIFF(DAY, @StartDate, @EndDate)
),
d(d) AS
(
    SELECT DATEADD(DAY, n, @StartDate) FROM seq
),
src AS
(
    SELECT
        [transaction_date]  = CONVERT(date, d),
        [year]          = DATEPART(YEAR, d),
        [month_number]      = FORMAT(d,'MM'),
        [year_month_number] = FORMAT(d,'yyyy-MM'),
        [year_month_short]  = FORMAT(d, 'yyyy-MMM'),
        [month_name_short]  = FORMAT(d,'MMM'),
        [month_name_long]   = FORMAT(d,'MMMM'),
        [day_of_week_number]= DATEPART(WEEKDAY, d),
        [day_of_week]       = DATENAME(WEEKDAY, d),
        [day_of_week_short] = FORMAT(d,'ddd'),
        [quarter]       =  'Q' + CAST(DATEPART(QUARTER,d) AS NCHAR(1)),
        [year_quarter]  = CAST(YEAR(d) AS NCHAR(4)) + '-Q' + CAST(DATEPART(QUARTER,d) AS NCHAR(1)),
        [week_number]   = DATEPART(WEEK, d)
    FROM d
)
INSERT INTO dimDate
SELECT * FROM src
ORDER BY transaction_date
OPTION (MAXRECURSION 0);
If your project needs extra years, the script will work the same. Simply change the start and end dates.
Step 4: Build the Sample Report
Now, you can create reports and dashboards that your stakeholders need.
Finally, you can build the reports and dashboards your stakeholders asked for. You may use Excel because most people are familiar with it. For more advanced needs, try Power BI or SQL Server Reporting Services (SSRS).
1. OUTPUT: SAMPLE REPORT
A possible report output for the data warehouse we’ve built is shown below. It uses Power BI to show product sales per period. A few more reports are possible with the DWH, like client sales or sales based on location.

ETL Tools for Data Warehousing
A SQL Server DWH by itself is just a storage hub. To make it valuable, it needs to be connected to your data ecosystem. ETL processes – Extract, Transform, Load – are what bring it to life, integrating services and sources so your analytics can actually solve business problems.
SSIS: On-Premises ETL for SQL Server
SQL Server Integration Services (SSIS) is what Microsoft created for heavy-duty on-premises ETL work. It lives inside SQL Server and excels at specific tasks.
- Data synchronization pulls information from multiple sources and lands it in one consistent place.
- Quality improvements come from scrubbing records, validating data, and standardizing formats before anything touches reporting.
- Automation through SQL Server Agent schedules packages that refresh warehouses without human intervention.
But SSIS demands serious setup work initially:
- Maintenance isn’t cheap or easy over time.
- You need developers who truly understand ETL architecture, not just surface-level knowledge.
Cloud or beginner-friendly alternatives may be preferable for rapid deployments.
Skyvia: Cloud-Based No-Code ETL, ELT, and Reverse ETL
Skyvia does ETL, ELT, and reverse ETL without making you write code or host anything. Made for scheduled file imports that happen consistently, particularly when you’re targeting multiple systems or the data needs serious work before it arrives clean.
Key features:
- Import – does classic ETL and extracts from SaaS, files, or databases, transforms through expressions and lookups, and loads into your warehouse on demand or schedule.
- Replication – runs ELT by maintaining a fresh copy of source data in SQL Server or another warehouse, handling schema creation and incremental syncs automatically.
- Data Flow (Advanced ETL/ELT) pulls from multiple sources, splits the flow conditionally, joins datasets together, transforms extensively, and pushes to various targets while triggers and schedules keep the whole operation running.

Skyvia’s cloud infrastructure and visual interface allow non-developers to move, transform, and maintain data efficiently. Users love its simplicity and flexibility, earning a 4.8/5 rating on G2 Crowd.
However, things don’t end with the ELT. Data arrives at DWH in its raw form first. The transformation happens later with data modeling tools, like dbt, erwin Data Modeler, ER/Studio, etc., which convert that unrefined information into structured models built for reporting and analysis. Your source systems never feel the changes; everything stays intact there.
How to Automate Cloud-to-SQL Server ELT with Skyvia
Let’s assume you store CSV files on Google Drive (or Dropbox, FTP, Amazon S3, etc.), but need them on your SQL server, too.
What can be done? Adding data manually? Always an option, but always a tedious one. Skyvia allows automated CSV file import/export to SQL Server running on a schedule.
For this task, we will use the Skyvia Import scenario.
Step 1: Create Connections
- Log in to your Skyvia account or create one. A 14-day free trial provides all the features paid plans offer, and once this term ends, you can continue to enjoy reduced features.
- Create a Google Drive connection. In the menu, click on +Create New and choose Connection.

- Sign in with Google and save the connection.

- Create SQL connection. If the server is behind a firewall or not exposed to external connections, use Skyvia Agent first. It is a safe link between Skyvia and the SQL Server on-site.

- Adhere to the page’s download and installation instructions.
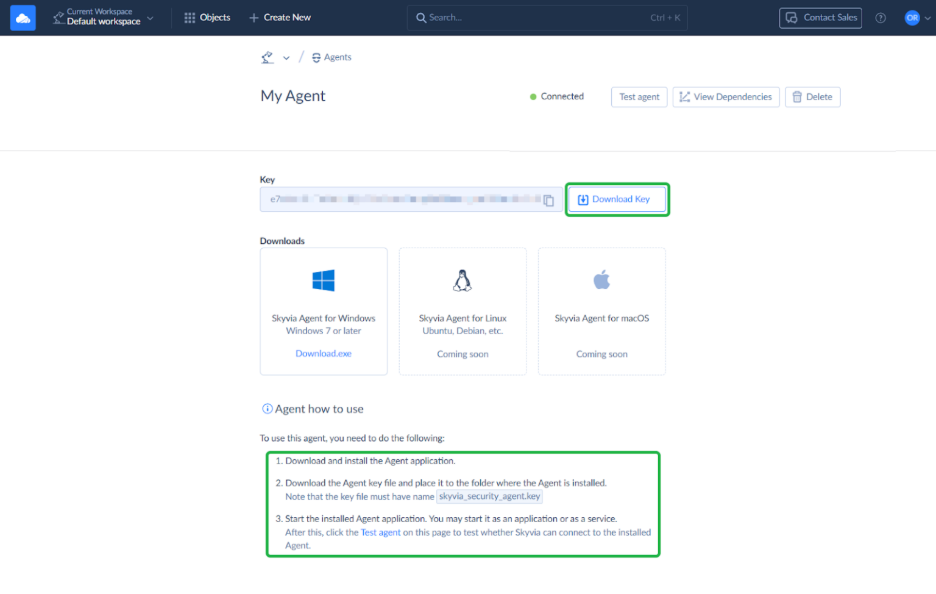
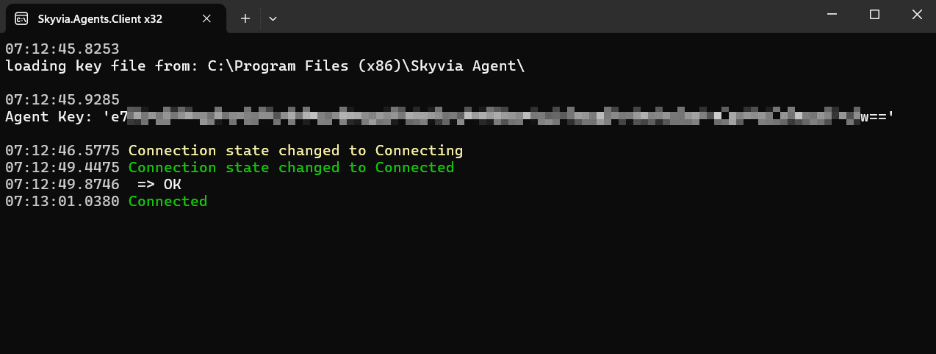
- Launch the Skyvia agent application that has been installed.
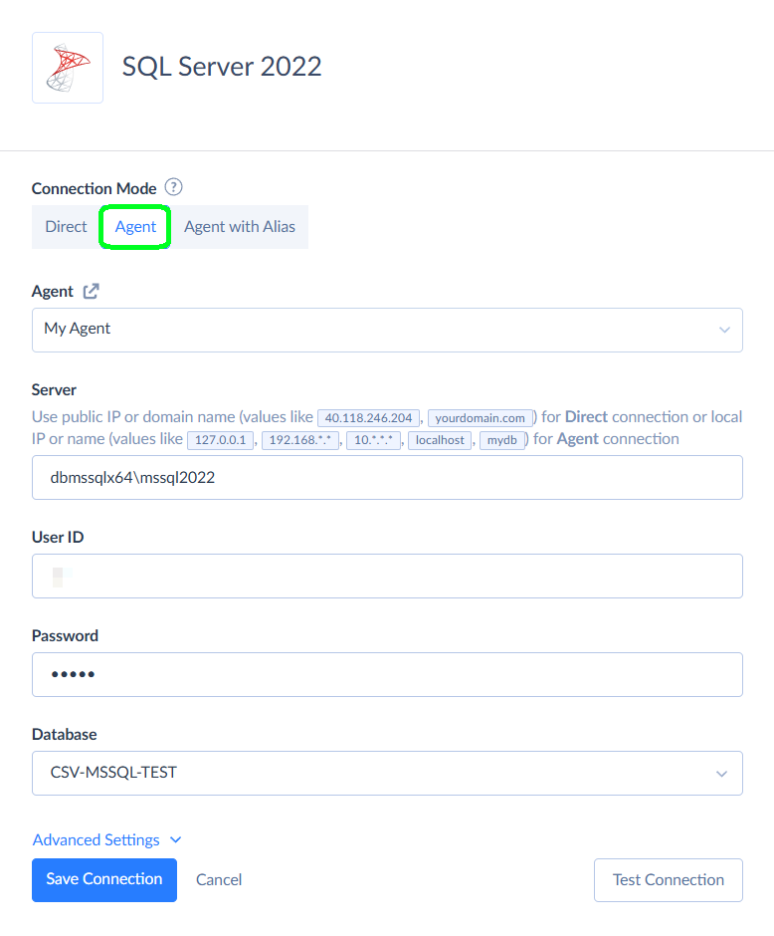
- Now, you can repeat the new Connection setup for SQL.
- Under Connection Mode, you’ll see Agent. Click it and pick the agent you created a few steps back.
- After that, enter your server name, add your credentials, and specify the database name you need.
Step 2: Create Skyvia Integration
- Once again, go to the +Create New menu, but this time choose Import.

- Pick your Google Drive connection for the source side, then point the target at your SQL Server connection.

Step 3: Create Integration Task
- In the integration editor, the Add new button creates your task. Click it.
- Choose the needed file from your Google Drive. Skyvia picks up the columns automatically, so you don’t need to map them manually.
Note: You can add as many tasks as many files you need to upload to the SQL server.
- Set up the next parameters: Text Qualifier stays blank. Code Page goes to Western European Windows (1252). The id column becomes DT_I4 (Integer).

- Pick your operation. You’ve got insert, update, or delete to work with. Let’s go with Insert here.

- Head to the mapping definition tab and connect your source file columns to the target table. That is where you adjust data to match what the destination expects. Skyvia matches columns with identical names automatically, but you can override that – map different fields using Column, Constant, Expression, or Lookup depending on what you need.

- Save the task, then save the integration itself.

Step 4: Launch the integration and verify the results
- You can trigger the integration manually on demand or configure a schedule for hands-free execution.

- Check the Monitor or Logs tabs to see how everything ran.

Conclusion
- Data warehouses bring scattered information together where analytics, reporting, and AI can actually use it.
- Staging areas offer space to consolidate and prep data before warehouse entry – quality control checkpoint.
- Dimensional models organize effectively: facts hold measurements, dimensions provide meaning.
- Star schemas are straightforward. Snowflake schemas handle nuance better. Match to reporting complexity.
- SQL Server scales, performs, and works with tools already in your environment.
- ETL and ELT are approaches to populating the DWH that keep data flowing and current.
- Data modeling tools convert raw data into insights that drive smarter business choices.
As you can see, a lot of components, tools, and processes to figure out, manage, and create for your SQL Server warehouse. No wonder the setup has a reputation for generating grey hair. But the payoff solves one fundamental problem – it turns data from noise into a signal. Without structure, you’re operating on hunches and fragments. With it, you’re working on evidence.
And with purpose-built tools that absorb grunt work, a team can finally focus on what the warehouse was built for. For example, when the foundation is established, Skyvia will help you manage the data population workflow for your models, the initial loading, and all further flows.
FAQ for Data Warehouse from SQL Server

Do ETL tools simplify the process of loading data into a data warehouse?
Yes, ETL (Extract, Transform, Load) tools do simplify data integration. They help clean, map, and load everything into the data warehouse while maintaining data quality and consistency. You can try Skyvia as your ETL tool for free.
Are there any options to try SQL Server for free?
Yes, you can experiment with the Community Edition of SQL Server. You can visit the SQL Server Downloads page to get an installer for your computer.
Can I scale my warehouse if needed?
Yes, SQL Server is designed to be scaled. You can handle data from small setups to large enterprise environments without compromising performance.