Most teams don’t wake up thinking, “Today feels like a great day to aggregate data.” It usually sneaks up on you. A quick export becomes a weekly ritual. A “temporary” integration turns permanent. And at some point, someone asks why five reports show five different results, so you start philosophical debates on the nature of truth.
That’s when choosing the top data aggregation tools in 2026 stops being a tooling decision and becomes a matter of self-preservation. Good tools reduce arguments, shorten meetings, and quietly prevent the kind of chaos that only shows up when numbers matter.
This article is a tour of the tools that actually earn their place in modern stacks – not because they sound impressive, but because they make an impact. Ready?
Table of Contents
- Introduction to Data Aggregation
- Importance of Data Aggregation Tools
- Overview of the Top 10 Data Aggregation Tools
- Comparison of the Data Aggregation Tools
- Criteria for Selecting Data Aggregation Tools
- Final Thoughts
Introduction to Data Aggregation
We promised you the best aggregation tools, but let’s take a step back and focus on the word “aggregation” to trace its roots and gain a clear understanding of what we’re looking for in our software. In Latin (yes, the step was quite big), the meaning of aggregation was to group items. So, when returning to data aggregation, it’s about grouping various kinds of data.
Why is it necessary?
Aggregation helps turn raw data into smaller, more meaningful summaries, especially when it starts expanding. It also contributes to noise reduction, which is critical to the accuracy of further analysis.
It helps to obtain value from the collection of data. For instance, you can discover the total number of work hours of each employee and detect whether there’s any overtime or underperformance. With aggregation, you can also calculate customer-related parameters, such as an average purchase amount, satisfaction rate, etc.
Importance of Data Aggregation Tools
Many processes stand behind aggregation, from collection to analysis. And there is a long way between these two procedures: grouping, transformation, transfer, and other operations.
Some tools perform end-to-end aggregation processes, starting from collection to visualization. However, most aggregation tools focus either on ingestion and preparation or analysis and visualization.
Aggregation tools are important because they can automate data collection from scattered sources. Then, you can blend and group input, apply aggregation functions, create pivot tables, build reports, etc.
Overview of the Top 10 Data Aggregation Tools
1. Skyvia
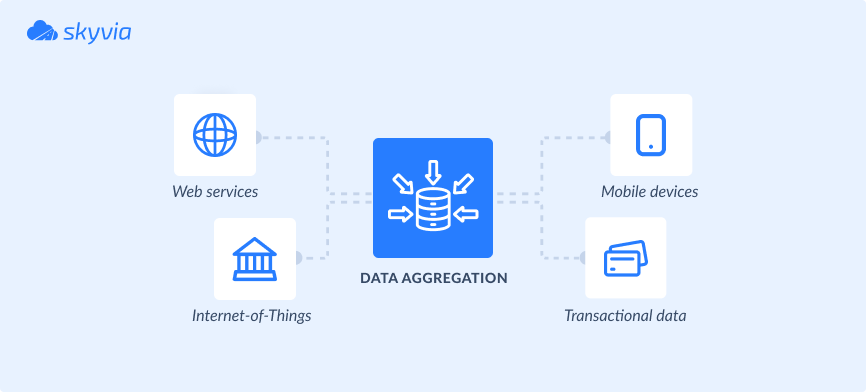
Skyvia is a leading cloud data aggregation platform that gathers data from more than 200 sources, standardizes and unifies it into a single dataset, and delivers it through an entirely visual, no-code workflow to any location.
The following Skyvia’s solutions would be particularly useful for aggregation:
- The Replication tool is a fast way to load (copy) records into a database or a warehouse from chosen apps using a visual wizard. Just create as many replication scenarios as the number of sources from which data is collected.
- The Import tool is a visual wizard where you can build ETL and Reverse ETL pipelines. For instance, you can import data from your CRM, ERP, and other business tools to a database or a warehouse. Import allows you to execute queries for data selection and apply aggregation functions on it. You’ll need to create an import scenario for each point-to-point integration and apply the needed transformations on a copy of the source data.
- Data Flow allows users to build more complex pipelines that span multiple sources and apply multistage transformations, such as lookups and expressions. Control Flow is used with Data Flow to implement task execution logic, perform pre- and post-integration activities, and configure automatic error processing.
- A Query allows users to gather data from selected sources using a visual query builder or SQL statements. Then, apply aggregation functions to group the output. Skyvia offers an Excel add-in and a Google Sheets add-on, allowing you to query data directly from a spreadsheet.
Key features:
- Source diversity. Extract records from applications, databases, warehouses, legacy systems, storage services, and flat files. Overall, connect to over 200 sources to move your data in and out.
- Data integration and aggregation. Select records from the preferred cloud source using the SQL query builder, then group them by a specified criterion. Skyvia supports the following aggregation functions: COUNT, AVG, MIN, MAX, and SUM. Then load it to the destination of your choice.
- Data transformation. Cleanse data and standardize its format to match the destination requirements.
Pricing:
- A free plan is suitable for those who operate <10,000 records per month. It offers one daily sync between a source and a destination, and standard transformation options.
- A basic plan is available starting at $79 per month and offers flexibility in data usage.
- A Standard plan is available starting from $159 per month. The overall cost depends on the amount of data processed. This plan includes hourly synchronization and 50 scheduled integrations per month.
- A Professional plan is available starting from $199 per month. Its price depends on the selected data amount. It offers a 1-minute interval for synchronization and update, multiplex transformations, and advanced integration scenarios.
- An Enterprise plan is a tailor-made offer that matches your needs. Discuss the pricing and requirements with the Skyvia team.
Suitable for:
- Startups.
- Small companies.
- Medium-sized businesses.
- Enterprises.
- Corporations.
- Non-profit organizations.
- Governmental institutions.
- Universities.
2. Alteryx
Alteryx is an enterprise analytics platform that aggregates and blends data from around a hundred sources through an intuitive interface, then lets teams analyze the consolidated data directly within the same environment.

Key features:
- Data aggregation with the Summarize tool. Drag and drop fields to group them and choose the aggregation function (SUM, COUNT, AVG, etc.). The outcomes obtained in the Summarize tool can be used in other tools on the Alteryx platform.
- Data blending. Combine records from several sources together and elaborate on them.
- Data cleaning. Remove extra spaces, delete duplicates, and detect missing values.
- Predictive and spatial analytics. Develop AI and ML-based models for advanced analytics insights.
Pricing:
- Designer Cloud starting from $4,950.
- Designer Desktop starting from $5,195.
- A 30-day trial is available.
Suitable for:
- Enterprises.
3. Talend
Talend pulls data from places that store information differently, reconciles the conflicts, and produces output that analytics platforms or downstream applications can consume without complaining.

Key features:
- SQL templates. Use system SQL templates or create custom ones to streamline querying. For instance, the Aggregate template already contains statements for aggregation.
- Visual job builder. Compose pipelines with drag-and-drop components in the visual builder.
- Data preparation. Standardize the aggregated data with available transformation options.
Pricing:
Talend Data Fabric runs cloud, on-prem, or hybrid, depending on your infrastructure. There’s no public pricing – it’s negotiated case-by-case with Talend based on deployment method and feature selection.
- Cloud costs less upfront, but charges scale with usage.
- On-prem means higher licensing but predictable infrastructure expenses.
Feature selection compounds this – basic integration versus full enterprise capabilities with governance and data quality can multiply costs significantly.
Though a free trial is available.
Suitable for:
- Enterprises.
4. Domo
Domo aggregates data from platforms that store information, like every department has its own rules, transforms it into something everyone can trust, and surfaces it in dashboards, so teams operate from a shared reality instead of dueling Excel files.

Key features:
- Extended connectivity. Domo has 1000+ pre-built connectors for the on-premises services, databases, warehouses, and cloud apps.
- Data blending. Combine and transform the aggregated data with commands and statements.
- Visualize data. Select the preferred visuals from a set of charts and maps to explore and analyze data.
- Mobile app support. Use an iOS or Android Domo app to view data and create reports.
Pricing:
The cost is defined individually for each Domo customer and depends on storage, update rates, number of queries, and users.
A 30-day free trial is available.
Suitable for:
- Small businesses.
- Medium-sized companies.
- Enterprises.
5. Looker Studio
Looker Studio is a web-based analytics tool that pulls data from hundreds of sources, aggregates it into unified reports, and turns scattered metrics into live dashboards you can actually use in day-to-day decisions.

Key features:
- Data blending and aggregation. The Blend Editor enables users to join tables visually instead of writing SQL statements.
- User-friendly interface. Looker Studio’s interface is very simple and understandable, allowing even non-tech users to elaborate on datasets.
- A wide availability of dashboard templates. There are many dashboard templates for Looker Studio on the web available for free. You can select the preferred one, aggregate data from necessary sources, and explore it. Such templates are available for practically any department or industry.
Pricing:
Looker Studio is completely free to use for those who have a Google account.
Suitable for:
- Small businesses.
- Medium-sized businesses.
6. Tableau
Tableau pulls from databases, cloud platforms, and file sources, brings everything into one space, then hands you interactive visuals to explore freeform until your brain connects dots the raw numbers never would’ve revealed.

Key features:
- Data aggregation. Tableau offers a range of aggregation functions (SUM, AVG, MAX, MIN, COUNT, MEDIUM, VARIANCE, etc.)
- Revision history. Revert up to 25 last versions of the selected dataset.
- Querying with plain language. The Ask Data feature allows users to get answers based on the given data by asking questions without any specific knowledge of programming languages.
- Mobile support. Access data and share insights using a mobile app.
Pricing:
- Tableau Viewer for viewing and interacting with dashboards at $15 per user per month.
- Tableau Explorer for exploring data with self-service analytics at $42 per user per month.
- Tableau Creator for an end-to-end analytics workflow at $75 per user per month.
Suitable for:
- Startups.
- Small and medium-sized businesses.
- Enterprises.
- Non-profit organizations.
- Government organizations.
7. Power BI
Power BI pulls data from files, databases, and online services into one aggregated space, rescuing you from the special kind of torment where every answer requires opening four spreadsheets and hoping they’re all measuring the same thing.

Key features:
- Data cleaning and preprocessing. Identifying duplicates, incorrect values, or incomplete records can deteriorate the quality of analysis.
- Data grouping. Grouping records by specific dimensions and applying the aggregation function (MIN, MAX, COUNT, AVG, SUM) via the Power Query Editor.
- DAX. Performing calculations and queries with DAX formula expression language, which is similar to SQL.
- Copilot. Asking data-related questions in plain language and getting AI-generated answers to them.
Pricing:
- Power BI Pro: $10 per user per month
- Power BI Premium: $20 per user per month
Suitable for:
- Startups.
- Small and medium-sized businesses.
- Enterprises.
- Non-profit organizations.
- Government organizations.
8. Apache NiFi
Apache NiFi operates as a flow-based aggregation engine, shuttling data around, merging streams, reshaping formats in real-time or batches while handing you precise control over how raw sources become organized, centralized feeds worth consuming.

Key features:
- Data availability acceleration. Apache NiFi is a catalyst for the execution of big projects.
- Integration with big data tools. NiFi easily connects to Apache Spark, Apache Kafka, Hadoop, Hive, MongoDB, Cassandra, etc., and collects and aggregates data from them.
Pricing:
Apache NiFi is an open-source solution, so it’s free to use. However, considerable investment is required for the deployment of the necessary underlying hardware resources.
Suitable for:
- Enterprises.
- Companies dealing with big data.
9. Segment
Segment is a customer data aggregation hub that pulls first-party user data from every touchpoint into a single, clean stream, so teams can activate it instantly for personalization, predictions, and smarter marketing decisions.

Key features:
- Source function. Collect and aggregate records from third-party applications.
- Transformation function. Fix bad records or standardize them to make them suitable for further processing.
Pricing:
- A Free plan with up to 500,000 Reverse ETL records and two sources.
- A Team plan starts at $120 per month with up to 1,000,000 Reverse ETL records and unlimited sources.
- A Business plan with advanced features and personalized volume at custom pricing.
Suitable for:
- Startups.
- Small businesses.
- Medium-sized businesses.
- Enterprises.
10. Fivetran
Fivetran is an automated data aggregation pipeline that pulls data from 700+ sources into your warehouse on autopilot, then leaves the “blend and transform” part to SQL so you can shape the dataset exactly the way your business needs.
Key features:
- Real-time data movement. Fivetran supports real-time data replication, creating a solid base for the timely collection and aggregation of the most recent data.
- Data lake management. Aggregate cleansed and standardized data in a data lake.
Pricing:
Fivetran is available under the free plan with up to 500,000 monthly active rows (MAR). The prices of other plans depend on the data amount, number of users, sync interval, advanced security features, and other factors.
Suitable for:
- Startups.
- Small businesses.
- Medium-sized businesses.
- Enterprises.
Comparison of the Data Aggregation Tools
Most of the above-mentioned tools provide a possibility to create data flows visually. That greatly simplifies and streamlines the daily work of data engineers, analysts, and scientists.
Other factors may also impact aggregation processes. Some of the crucial ones are mentioned in the table below.
For more details, you can also review a detailed comparison of data aggregation tools:
| Tool | Connector coverage | Pricing options | Suits best |
|---|---|---|---|
| Skyvia | 200+ connectors | Free plan + paid tiers start at $79 a month | SMB to mid-market teams that want no-code movement/aggregation with schedules and repeatability |
| Fivetran | 700+ connectors | Usage-based pricing tied to MAR (Monthly Active Rows) + each connector is priced separately | Teams doing “set-and-forget” ELT into a warehouse, with engineering ownership |
| Talend | 1,000+ connectors | Free Open Studio for basic needs; typically, enterprise subscription / quote-based (varies by bundle and deployment) | Enterprises needing governance-heavy integration + data quality + platform breadth |
| Domo | 1,000+ connectors | Usage-based pricing; for precise numbers, you need to talk to sales + Free version | BI-led orgs that want centralization + dashboards + apps in one environment |
| Looker Studio | 20+ native + over 1000 partner and community connectors | Free tier + Looker Studio Pro often cited at $9 per user per project (but that’s a 3rd-party summary) | Teams living in Google Workspace that want lightweight reporting and sharing |
| Tableau | 100+ built-in connectors | Tableau Standard is $75 per user per month (additional users will cost $15) | BI teams that need strong viz + governance and are OK with a heavier analytics stack |
| Power BI | Over 200 native connectors through Power Query | Free tier; paid options start at $14 a month per person | Microsoft-first orgs (M365/Fabric) that want fast time-to-dashboard and broad adoption |
| Apache NiFi | 300+ processors, which serve as its core connectors | Open source (no license fee; cost is infrastructure + ops) | Data/platform teams that want configurable, on-prem friendly data routing and flow management |
| Segment (Twilio Segment) | 700+ pre-built connectors | Free tier; paid tiers start at $120 a month | Product analytics + marketing ops teams building customer pipelines |
| Alteryx | 65+ connectors | Starter Editions cost $250 per user per month. Anything more serious needs a conversation with sales | Analytics teams that want low-code data prep + analytics workflows (often enterprise) |
Criteria for Selecting Data Aggregation Tools
Each business has its own expectations regarding the aggregation process. Based on these expectations, the requirements for the tool selection are formed.
While price is usually the most significant criterion, you should consider the whole offer:
Scalability and performance
- Handles increasing row counts without degrading query times.
- Supports parallel or cloud-native execution.
- Keeps common aggregations (SUM, AVG, GROUP BY) fast at scale.
Integration and connectivity
- Native connectors for databases, SaaS tools, APIs, and files.
- Minimal setup when adding new sources.
- Smooth handoff to BI tools like Tableau, Power BI, or Looker Studio.
Data quality and reliability
- Built-in validation and schema checks.
- Deduplication and consistent formatting.
- Clear error reporting instead of silent failures.
Usability and team adoption
- Visual or readable workflows.
- Logs that explain what happened, not just that something failed.
- Low learning curve for analysts and engineers alike.
Security and compliance
- Encryption in transit and at rest.
- Role-based access and permissions.
- Audit trails for regulated or sensitive data.
Cost and long-term sustainability
- Predictable pricing as volumes grow.
- Free or trial tiers for evaluation.
- Reasonable operational overhead after launch.
Skyvia can be a win-win for your business because it satisfies all of the above-mentioned criteria. It offers pricing plans matching various budgets and aggregation needs. Moreover, it allows you to collect data from more than 200 cloud apps, databases, and warehouses. Skyvia is one of the most user-friendly tools, and users rate its overall functionality at 4.8 on G2.
Final Thoughts
Data aggregation tools aren’t just about pulling records together. They’re about taking dozens of disconnected signals – from apps, databases, and systems that were never meant to cooperate – and turning them into something coherent. When aggregation works, you stop guessing. Trends become visible, comparisons make sense, and decisions stop relying on half-updated spreadsheets.
That’s why the choice of tool matters. Some solutions look powerful but demand constant babysitting. Others simplify the setup so much that you lose flexibility later. The sweet spot is a tool that does the heavy lifting quietly, adapts as your data grows, and doesn’t turn every new source into a mini-project.
If that balance is what you’re after, Skyvia is worth a closer look. It lets you connect sources, aggregate data, and keep everything in sync without building pipelines by hand. Start with the free plan, plug in a few sources, and see how much easier aggregation feels when it stops getting in your way.
F.A.Q. for Best Data Aggregation Tools

What’s the difference between data aggregation and data summarization?
Think of aggregation as organizing the mess on the table. Summarization is stepping back and saying, “OK, what does all this actually tell us?” One prepares; the other gives a point.
How do you choose a data aggregation tool for a small business?
Ignore the enterprise buzzwords and ask one question: “Can this grow with us without becoming a second job?” The right tool connects easily, stays affordable, and doesn’t punish you for not having a full-time data team.
How technical do you need to be to run a data aggregation tool?
It depends on the tool, not the task. Some expect SQL, pipelines, and patience. Tools like Skyvia are built so analysts and ops teams can aggregate records visually and move on with their day.
What about security and privacy when aggregating data?
Aggregation helps reduce exposure, but it’s not a safety net by itself. You still need clear access rules, encryption, and visibility into who can see what – especially once the data starts spreading across teams.