We’re currently living in the epoch of the Industrial Revolution 4.0. It has introduced cloud computing, IoT, robotics, artificial intelligence, and data analytics. These things relate to real-time data collection and processing, and all that comes in large amounts.
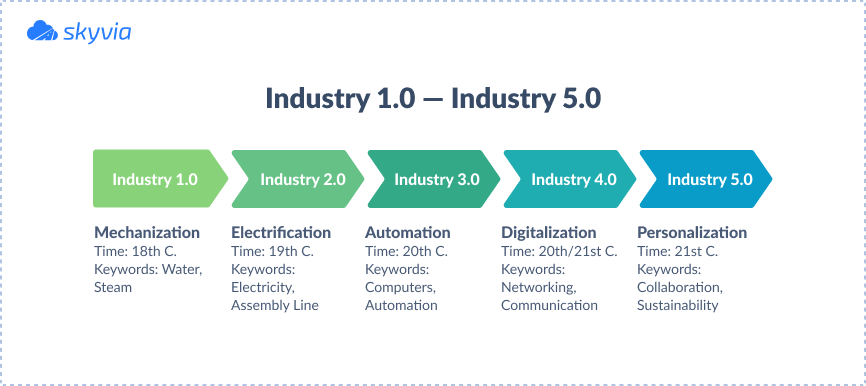
The concept of big data evolved during this industrial revolution, where ‘big’ stands not only for the amount but for the variety and velocity at which data streams flow. Companies need lifebuoys to stay afloat in these streams and prevent themselves from sinking. Luckily, there are big data tools that come as life vests for organizations.
This article focuses on various types of big data software, ranging from storage and management solutions to data analytics tools. It also discusses the necessity of implementing big data analytics tools for organizational advancement.
Table of Contents
- Types of Big Data Software: What You Need for Your Business
- 15 Most Popular Big Data Tools
- Different Types of Big Data Analytics
- Uses and Examples of Big Data Analytics
- Conclusion
Types of Big Data Software: What You Need for Your Business
One of the ‘V’s characterizing big data stands for ‘variety,’ and it refers not only to the myriad of types but to the diversity of the big data solutions. So, let’s look at the most widely used software categories for working with massive amounts of data.
- Data Storage and Management. This tool mainly involves big data cloud solutions and traditional relational databases. Modern cloud-based data storage and management tools involve well-known Google Cloud, AWS, IBM Cloud, and NoSQL databases, such as Cassandra.
- Data Processing. This category of big data solutions describes platforms that perform calculations and other manipulations on data. A popular data processing tool, Apache Hadoop, takes data from distributed locations and applies the MapReduce paradigm to it.
- Data Integration and ETL Tools. Skyvia, Matilion, and Talend are some of the major players in the data integration market. They are perfect for fast data exchange between tools or data consolidation on a single platform.
- Data Visualization and Analysis. One of the most famous big data visualization and analytics tools is called Tableau. Other popular solutions for big data analytics software are Apache Spark, Power BI, Looker (Google Data Studio), and RapidMiner. Those are great helpers to data analysts, BI specialists, and top managers. Apache Storm is another analytics tool suitable for working with real-time data flows in the financial and banking sectors.
- Workflow Management. Such tools are divided into two main subcategories: data orchestration with engineering pipelines (Apache Airflow) and task management (Monday.com).
Even though there’s a rigid classification of big data tools, most of them still carry out several functions simultaneously. Thus, Tableau is not only a data visualization service but also a powerful analytics solution. Skyvia is not only used for building ETL pipelines but also for workflow automation. See what potential Skyvia has and which useful functions it offers for your business!
The list of multipurpose platforms can expand further and further. However, businesses don’t have much time to decide which software instruments to use. That’s why we have simplified the thing by presenting the most promising and effective big data tools for businesses.
15 Most Popular Big Data Tools
Given the classification provided above, there’s a variety of big data solutions. Not all of them should be obligatory present in every business. Large organizations might implement more tools, while small businesses might go fine with only several applications. So here we present the 15 most popular big data tools, most of which provide broad functionality for dealing with massive amounts of data.
Skyvia
One of the best big data ETL tools is Skyvia – the most user-friendly cloud-based platform for building simple and complex data integration scenarios. Skyvia’s Integration components are Import, Export, Synchronization, Replication, Data Flow, and Control Flow. This tool also allows performing data management tasks with SQL and creating OData services.
Functionality
- Automates data collection from disparate cloud sources and replicates it to a database or data warehouse.
- Sends consolidated data from a data warehouse to business applications (reverse ETL).
- Imports/exports data to/from cloud apps, databases, and CSV files.
- Simplifies data migration between applications.
- Backs up and protects business-critical data.
- Allows sharing data in real-time via REST API to connect with multiple OData consumers.
- Allows managing any data from the browser by querying it using SQL or intuitive visual Query Builder.
Pricing
- Free plan
- Basic plan starting from $79/month
- Standard plan starting from $199/month
- Professional plan starting from $399/month
- Enterprise plan matching particular regulatory requirements at a custom price.
To select a plan that suits you best, contact Skyvia Sales Team to schedule a demo and get further details.
RapidMiner
RapidMiner is a contemporary platform allowing users to build machine learning models primarily. It offers a broad range of data-related procedures, including loading, preprocessing, transformation, and visualization. Industries that heavily rely on insights provided by machine learning (healthcare, finance, automotive, etc) can consider RapidMiner as a perfect helper for their needs.
Functionality
- Imports data from databases, SaaS platforms, cloud applications, etc.
- Provides necessary data transformation and cleaning options.
- Splits data into training and test sets automatically when working with machine learning techniques.
- Supports fundamental algorithms for supervised (decision trees, SVM, kNN, linear regression) and unsupervised (K-Means clustering, DBSCAN) machine learning.
- Grants an opportunity to add code in Python or R programming language for advanced users.
Pricing
It’s necessary to fill in the form on the official website to get the cost of RapidMiner.
Apache Hadoop
Widely known Apache Hadoop consists of modules, each carrying out its function on big data.
- The HDFS component stores data on distributed clusters, ensuring high reliability and fault tolerance.
- The MapReduce operation processes distributed data.
- The YARN module schedules job tasks and manages resources.
Functionality
- Distributed storage of data on commodity hardware.
- Parallel processing of data dramatically speeds up the entire data pipeline.
- Text mining and semantic analysis using the MapReduce module.
- Log analysis based on detailed log files generated by apps.
Pricing
Hadoop is free.
Cassandra
Named after the Greek prophet, Cassandra NoSQL database also has its superpower. It stores data of any format and structure. This solution is popular in industries producing objects beyond the standards of traditional relational databases.
Functionality
- Handles data of any structure and type, so it’s possible to store text information as well as images, sounds, and video there.
- Scales automatically on demand.
- Ensures tremendous fault tolerance due to replication strategies.
Pricing
Cassandra implements dynamic pricing models corresponding to the preferred computing power and storage capacity.
Power BI
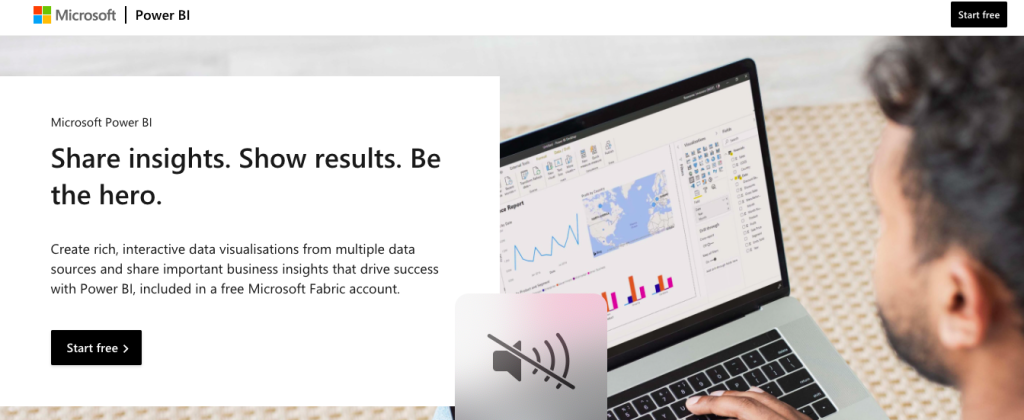
Microsoft’s tool, Power BI, has conquered the market due to its ability to create visually appealing dashboards. This service is widely used by data scientists, business analysts, and business intelligence professionals across multiple industries. It’s also popular owing to compatibility with other Microsoft products.
Functionality
- Supports real-time stream analytics.
- Connects to various sources, including databases, online services, and files.
- Creates interactive reports with many visual options.
- Provides a wide range of data exploration functions: slicing, filtering, drill-through, etc.
- Allows users to share reports with specific user groups for enhancing collaboration.
- Integrates machine learning models for predictive analysis.
Pricing
Microsoft offers a free version of Power BI with many features. There’s also a Pro version for $9.99/month and a Premium version for $20/month with advanced functions.
Tableau
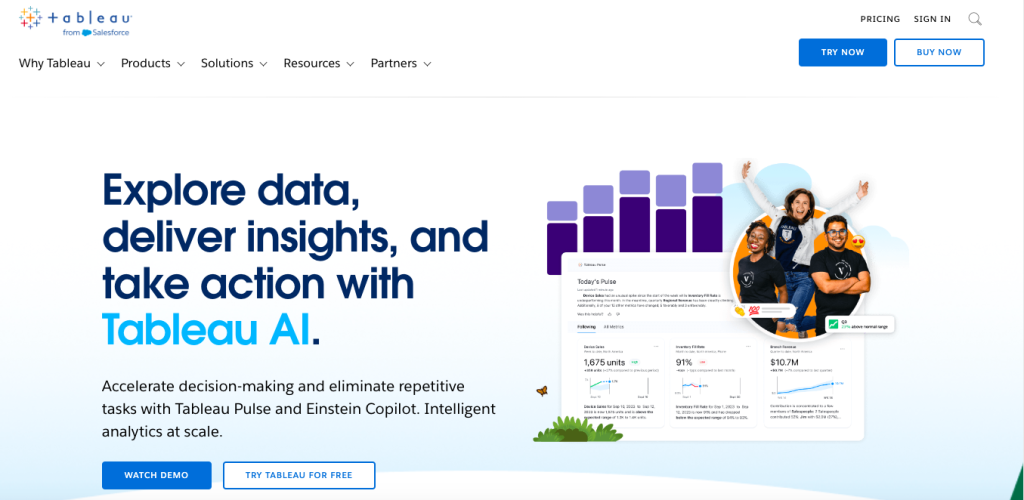
Tableau is another analytical tool with a strong focus on visualization. It’s widely used not only by professionals in the data-driven industry but also by non-technical experts, students, teachers, and so on. Tableau helps people to better understand complex things and encourages them to take advantage of data.
Functionality
- Ensures secure sharing of data in the form of sheets and dashboards with others.
- Provides powerful data transformation tools for cleaning, duplicate removal, filtering, and missing values handling.
- Has pre-installed geographical maps, making it possible to add different layers there.
- Offers desktop, online, and mobile versions of the product.
Pricing
- Tableau Viewer costs $15/month.
- Tableau Explorer costs $43/month.
- Tableau Creator costs $75/month.
Zoho Analytics
Modern BI and data exploration service Zoho Analytics is a part of the Zoho platform. It might be particularly suitable for those who use other Zoho tools in their daily workflow. Zoho Analytics is for data analysis and visualization across marketing, sales, and finance departments.
Functionality
- Prepared data for analysis by cleansing and enriching it.
- Augments data-driven insights with AI and ML technologies.
- Provides a unique language for performing complex calculations and aggregations.
Pricing
The monthly cost for the service depends on the number of users and data records involved.
Cloudera
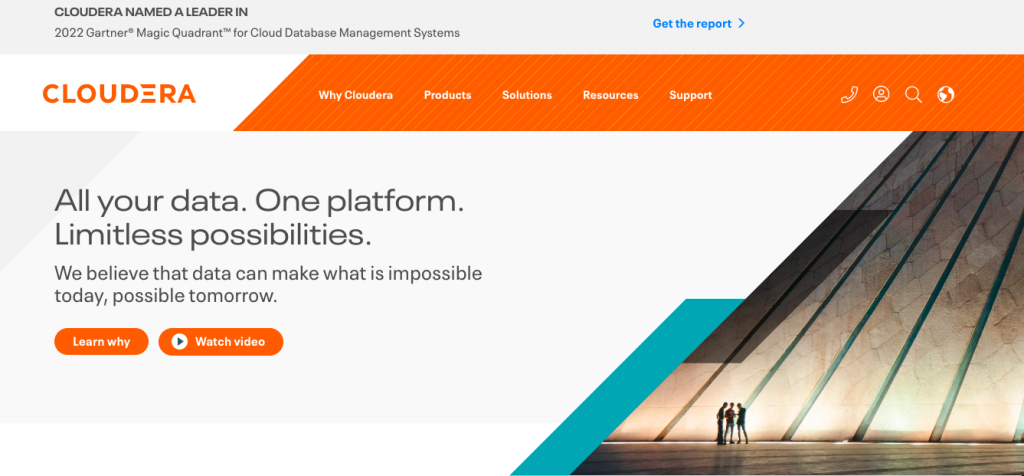
Since 2008, Cloudera has been helping enterprises to manage, process, and analyze large amounts of data. In 2022, Gartner Magic Quadrant named Clouder, a leader in cloud database management systems.
Functionality
- Allows creating data warehouses and data lakes for storing raw data of any structure.
- Offers advanced data processing with either an embedded CDE module or Hadoop.
- Provides analytics functions either with the embedded CDV module or integrated tools such as Power BI or Tableau.
- Contains libraries for deploying machine learning models and artificial intelligence algorithms.
- Handles real-time data from IoT devices and sensors.
Pricing
Cloudera implements a progressive cost model, where the price is estimated based on the cloud capacities and available features.
Qubole
Qubole is a simple and secure data lake platform based on popular cloud providers (AWS, Google Cloud, Oracle Cloud, Microsoft Azure). It’s perfect for big data analytics, machine learning, ad-hoc analytics, and cloud engineering.
Functionality
- Big data processing in the cloud.
- Building and deployment of ML models.
- Workflow automation with automated scheduling.
- Ad-hoc querying.
Pricing
Qubole can be used for free during the 30-day trial period. Then, the payment on-demand applies, considering the compute unit used.
MongoDB
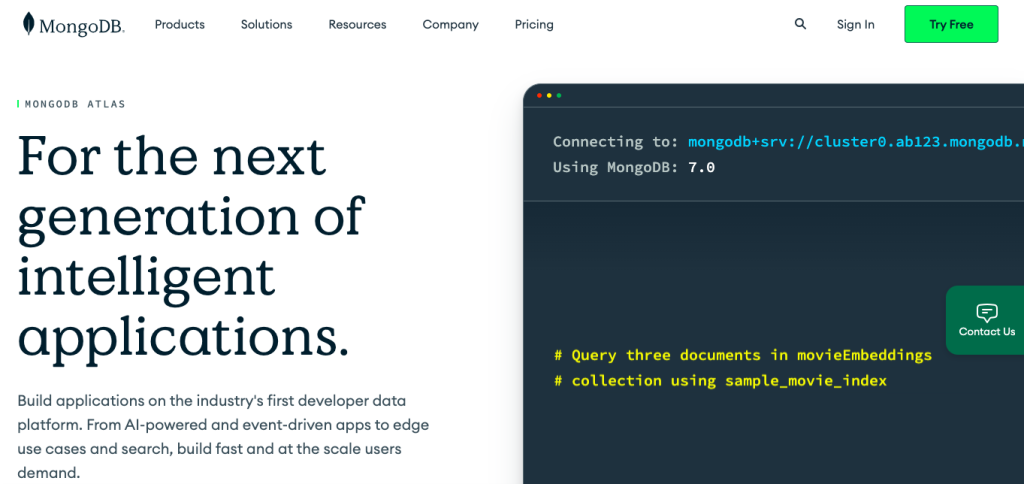
Similarly to Cassandra, MongoDB is also a NoSQL database management system. It utilizes a document-oriented approach for managing semi-structured and unstructured data. That’s why MongoDB could be a good choice in gaming, entertainment, education, healthcare, logistics, and IoT industries.
Functionality
- Supports secondary indexes for query performance optimization.
- Supports ACID transactions, ensuring atomicity, concurrency, isolation, and durability.
- Provides data sharding for distributing data across servers.
- Applies advanced data compression mechanisms.
Pricing
The cost model depends on the purpose of use:
- Shared – provides basic configuration options for exploring MongoDB at a $0.00/month cost.
- Serverless – suitable for serverless applications with infrequent traffic with the cost starting from $0.10/million reads.
- Dedicated – provides advanced configuration options for deploying applications at $57/month.
Apache Spark
Apache Spark is an open-source solution for storing and processing data in real-time. It supports different programming languages (R, Python, Java, Scala), which makes this engine adaptable for various applications.
Functionality
- Batch data processing in real-time streaming.
- Querying data with SQL for creating dashboards and reports.
- Training machine learning models at scale.
Pricing
Apache Spark is an open-source service that’s free to use.
datapine
datapine is a modern big data analytics solution with BI and visualization capabilities. It’s considered by many data scientists and BI specialists in multiple industries.

Functionality
- Integrates with various data sources (databases, applications, data warehouses).
- Allows users to explore their data.
- Uses predictive analytics to make forecasts.
Pricing
datapine offers packages for startups at $219/month as well as for enterprises at a negotiable price.
Apache Storm
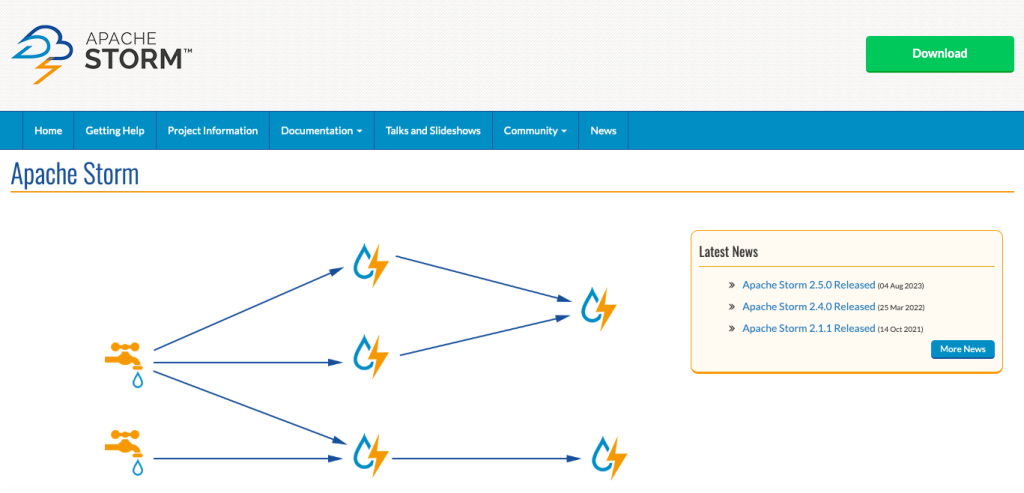
Originally developed by Twitter, present-day Apache Storm has always had real-time data streams in mind. It aims to address petabytes of constantly generated data. Storm is usually used with other Apache solutions for comprehensive big data processing and analytics.
Functionality
- Processes data in parallel threads, the number of which depends on the current load.
- Provides developer-friendly API.
- Support multiple programming languages (Java, Ruby).
Pricing
Free to use.
Matillion
Matillion is another data integration software tool for organizing data engineering pipelines. It’s often used to collect data from business apps, transform it if needed, and send it to data warehouses.
Functionality
- Automates data workflows.
- Schedules job to run at a specific time.
- Ensures both batch and real-time data ingestion methods.
- Provides monitoring and logging of integration processes.
Pricing
The service cost depends on the number of credit units (virtual core hours).
Talend
Talend is an open-source data integration tool for operating various data-related tasks. It contains a set of data collection, processing, and management components. Talend works with cloud data sources as well as on-premises and hybrid platforms.
Functionality
- Data preparation
- Pipeline design
- Data inventory
- Data integration
- Data replication
Pricing
All the prices are available upon contacting the Sales team.
Different Types of Big Data Analytics
All the tools mentioned above somehow relate to big data analytics – directly or indirectly. Tableau or Power BI is used first-hand by data scientists and analysts. Meanwhile, Skyvia helps to cleanse and transform data before loading it to a DWH for storage and analysis.
Data solutions act like an orchestra, where each instrument carries out its specific function for the sake of ideal sounding. In the data world, the result is visible through data analytics that helps businesses reduce operational costs and make better decisions.
To take advantage of big data analytics fully, it’s worth noting its various types and purposes.
- Descriptive Analytics. It basically shows the results in metrics (turnover rate) or statistical indicators (average salary rate) based on past data from various departments.
- Diagnostic Analytics. Its primary purpose is to answer why a specific event has taken place. Diagnostic analytics explore the correlation of factors describing the event.
- Predictive Analytics. Uses large amounts of available data to derive regularities that could be used for predicting the future. It’s often used in machine learning models and simulations.
- Prescriptive Analytics. It’s the advanced form of predictive analytics where a concrete action is prescribed for each prediction.
Uses and Examples of Big Data Analytics
It’s easy to tell that ice cream sales increase on hot summer days and drop down in autumn when the air gets chilly. However, analytical tools can clarify the case by adding predictions for product amounts based on the patterns derived from historical data.
While considering seasonal and climatic correlations seems rather intuitive, this can be applied mainly to food, tourism, and some other industries. How to know when people start buying more watches or subscribing to video streaming platforms? Big data analytics can give answers to all these questions. So, let’s look at some use cases and real-life examples of how different types of analytics could be applied to business environments.
Risk Management Strategy Design
Predictive and prescriptive analysis can shed light on potential risks that could impact business and offer preventive actions to mitigate them. Existing data of the current company and its competitors can be used for designing a risk management strategy.
Product Development Approach
Diagnosis analysis allows the discovery of patterns and trends based on the correlation between consumer behavior and sales rates. This gives a clearer view of the approximate production volume and human power needed.
Operational Process Optimization
Analytics helps to understand why turnover happens and what kind of workers are prone to change jobs frequently. This helps organizations select the appropriate candidates during the recruitment stage and improve their corporate culture.
Customer Experience Improvement
Survey and interview analysis aims to explore customer experiences and expectations. Such information is valuable for improving customer experience and brand loyalty.
Conclusion
The way of data is long in the digital world – it starts from collection to analysis. However, it’s crucial to manage it properly during all stages of its journey. Here comes Skyvia for data consolidation, management, transformation, and integration. It easily ingests data from apps, SaaS platforms, and data storage platforms to be sent to a DWH for storage, transformation, and further analysis in the corresponding tools. Experience this data journey together with Skyvia, and you can start it gratis today!


