In today’s highly competitive business world, strategic insights are more critical than ever. An excellent report helps businesses succeed by turning data into useful information. Global CRM platforms, such as Salesforce, are catching up with trends in meeting reporting needs. Together with that, third-party specialized reporting tools are still popular among organizations. In this article, we talk about reporting in general, review the most popular reporting tools for Salesforce, and share some helpful ideas on effective reporting.
Table of Contents
- Introduction to Salesforce Reporting
- TOP Salesforce Reporting Builders
- Salesforce Reporting Tools: A Feature-by-Feature Comparison
- The Benefits of Using the Salesforce Reporting Tool
- How to Build an Advanced Salesforce Report
- How Skyvia Enhances Your Salesforce Reporting Experience
- Wrapping Up Salesforce Reporting Insights
Introduction to Salesforce Reporting
When it comes to Salesforce, analysis and visibility are vital for teams. Companies analyze progress, find obstacles, and improve strategies to succeed in business.
Reports demonstrate Salesforce data in a readable form. They help users to analyze and visualize data for further use to achieve global business goals. Reports assist organizations in using data to make decisions, track accomplishments, and assess company effectiveness effortlessly.
Salesforce users’ reporting needs depend on the data they work with, the team they work with, and the goals they face. Account and Contact reports help sales teams learn information about customers. Administrative reports help users analyze data about tasks and appointments and explore the general data about Salesforce users’ activities, Salesforce documents, pending approvals, and more. Marketing teams use various reports in Salesforce to track marketing indicators, manage leads and opportunities, and evaluate campaign success. Sales engagement reports help track the sales representatives’ efforts and achievements.
Teams use opportunity reports to retrieve information about opportunities, including owners, accounts, stages, amounts, and more. Salesforce users often build custom reports to compile comprehensive reports for more flexibility.
Many tools offer various reporting capabilities for users. Let’s review the top five of them you can consider for your business.
TOP Salesforce Reporting Builders
We have collected the characteristics and advantages of the most popular reporting software to help you pick the best tool to build the most compelling reports for your Salesforce organization.
Native Salesforce Reporting
Salesforce offers built-in software for analysis and reporting. It allows having Salesforce data and reports in one place. Native Salesforce reporting provides a comprehensive and user-friendly solution for analyzing and visualizing data within Salesforce. It offers seamless integration with your data by real-time access. The key benefits of the native Salesforce reporting are the following.
Native Salesforce Reporting Benefits
- Seamless integration to Salesforce objects and real-time access to data.
- Intuitive Salesforce report builder.
- Wide range of report types and customization capabilities.
- Seamless dashboard integration and report sharing.
- Security and audit trails. Salesforce protects sensitive data and ensures the transparency of controlling access and actions with the reports.
Native Salesforce Reporting Cons
- Quite limited advanced reporting capabilities.
- Limited cross-object reporting and external data integration.
- Narrow visualization options.
Tableau for Salesforce Reporting
Tableau is a data analytics and visualization platform. It offers you a wide range of advanced features for your Salesforce data. Tableau integrates seamlessly with Salesforce, enabling users to connect directly to Salesforce data and create rich visualizations without complex data extraction processes. It is user-friendly and comfortable for users with any level of technical expertise.
Tableau Benefits
- Advanced features for data visualization and reporting. Sophisticated charts, graphs, and dashboards enable interactive reporting.
- Direct integration with Salesforce.
- Data blending and cross-database joins allow you to analyze data from multiple sources beyond Salesforce.
- Flexibility and customization capabilities. You can tailor any special dynamic and interactive report for your Salesforce data.
Tableau Cons
- It may be quite expensive for large organizations.
- Steep learning curve for those who is new to business intelligence and data visualization.
- Limited data transformation capabilities.
Klipfolio for Salesforce Reporting
Klipfolio is a cloud-based dashboard platform designed to empower your data reporting. By leveraging Klipfolio for Salesforce data reporting, organizations can benefit from a versatile and user-friendly platform that enhances the visualization, analysis, and sharing of Salesforce data.
Klipfolio Benefits
- Customization capabilities. It allows you to tailor dashboards with various visualizations, heat maps, scatter plots, and gauge charts unique to your individual reporting needs.
- Flexible data manipulation. You can prepare, transform, and apply calculations to your data for the report.
- Easy to use and integrate with Salesforce and other supported connectors.
- Automated reporting. Klipfolio supports scheduling reports and automatically distributing reports to users by email and shared links.
Klipfolio Cons
- Steep learning curve. Users, who are new to advanced reporting tools may need some time to get used to.
- Data integration limitations.
Smartsheet for Salesforce Reporting
Smartsheet is a cloud tool for collaboration, reporting, and management. You can integrate Smartsheet with Salesforce to enhance the data analysis process.
Here are some benefits of using Smartsheet for Salesforce reporting.
Smartsheet Benefits
- Flexible and customizable reports and dashboards that you can tailor to specific business needs.
- Easy integration with Salesforce and real-time reporting.
- Smartsheet allows multiple users to work on reports simultaneously.
- Smartsheet supports forms and data collection. It supports forms to collect user or stakeholder data and integrate it with Salesforce.
- Smartsheet includes Gantt chart functionalities, enabling users to visualize project timelines and dependencies.
- Audit trails.
Smartsheet Cons
- Steep learning curve. Advanced reporting and visualization capabilities require time to learn.
- Data transformation limitations.
G-Connector for Salesforce Reporting
G-Connector is a tool that functions as a virtual bridge between Salesforce and Google Sheets. It enables direct bi-directional synchronization between Salesforce and Google Sheets. It allows you to share Salesforce reports with users outside your organization and ingest data back to Salesforce.
G-Connector Benefits
- Bi-directional data flow.
- Automatic and manual data exchange.
- Intuitive drag and drop interface.
G-Connector Cons
- Limited visualization and advanced reporting features.
- Flexibility and customization capabilities.
Skyvia for Salesforce Reporting
Skyvia is an all-embracing SaaS platform that provides solutions for various data-related tasks. Skyvia enables querying data from Salesforce or any other supported data source to Excel or Google Sheets reports using Skyvia Query tools. User-friendly query builder allows non-tech people to execute complex SQL queries against multiple Salesforce objects. You can create Salesforce reports in Excel and Google Sheets using Skyvia Query Excel Add-in and Skyvia Query Google Sheets Add-in. Skyvia ETL, Reverse ETL, and ELT tools can also enhance your reporting experience with other tools. Find more details below.
Skyvia Benefits
- Powerful data integration capabilities.
- Connectivity services.
- Cross-object reporting, automatic and manual data exchange.
- Great data transformation opportunities
Skyvia Cons
- Limited visualization capabilities.
Salesforce Reporting Tools: A Feature-by-Feature Comparison
As you can see, there are various reporting opportunities for Salesforce users. We listed the top 5 tools for Salesforce data analysis. And we summed up their most important benefits. We also compared the benefits and features of each tool for you. See the comparison table below.
| Feature | Tableau | Klipfolio | Smartsheet | Native Salesforce Reporting | G-Connector |
|---|---|---|---|---|---|
| Data Visualization | Yes | Yes | Yes | Yes | No |
| Real-Time Reporting | Yes | Yes | Yes | Yes | No |
| Custom Dashboards | Yes | Yes | Yes | Yes | No |
| Data Integration | Yes | Yes | Yes | Yes | Yes |
| Collaboration Features | Yes | Yes | Yes | Yes | No |
| Automated Reporting | Yes | Yes | Yes | Yes | Yes |
| Mobile Accessibility | Yes | Yes | Yes | Yes | No |
| User-Friendly Interface | Yes | Yes | Yes | Yes | No |
| Advanced Analytics | Yes | No | No | Yes | No |
| Budget-Friendly | No | Yes | Yes | Yes | Yes |
| Security Features | Yes | Yes | Yes | Yes | Yes |
| Scalability | Yes | Yes | Yes | Yes | No |
| Customer Support | Yes | Yes | Yes | Yes | No |
The Benefits of Using the Salesforce Reporting Tool
Users face various challenges when preparing reports. The data may originate from multiple sources. Data must always be relevant, fresh, and available in real-time. It is crucial to have an opportunity to customize a report and transform data if needed. Plus, report visibility and appearance play an important role. And last but not least is data security and compliance with safety standards. The ability to meet all these challenges forms the list of features that make the Salesforce reporting tools valuable.
- Data aggregation and integration. The ability to consolidate data of different structures from multiple sources may solve the problem of manual integrations and transformations.
- Customizable reporting allows users to tailor the special reports for specific business needs.
- Real-time insights. The report, able to deliver real-time data, eases the pain of constantly keeping data up-to-date.
- Advanced visualization does all the work of transforming raw data into meaningful insights.
- Automated reporting and scheduling help to organize the reports’ delivery.
- Audit trailing and other security features help to keep data safe.
- User-friendly interface. Comfortable Salesforce report builder saves time on learning and exploring the reporting or analytics tool.
How to Build an Advanced Salesforce Report
Reporting is a process. It requires more than just a user-friendly tool. Although an effective reporting tool is essential, it is not enough for an excellent Salesforce report. Below, we outline some tips to make your report stand out. See ten steps to perfect Salesforce reporting.
STEP 1 Clarify Your Objectives
A good plan is a significant part of success. Knowing the data and desired results makes building a report easier.
STEP 2 Simplify Your Data Sources
Having diverse data sources and varied data structures is wonderful. This expands the possibilities for your Salesforce report. But more doesn’t mean better. The overloaded report risks losing meaning. You should accurately define the major data sources and fully understand what exact data you need from these data sources.
STEP 3 Establish Key Performance Indicators
KPIs reflect the specific processes, teams, and functions achievements. Determine the most representative measurements which reflect performance the most accurately.
STEP 4 Select Appropriate Data Visuals
The design of your Salesforce report determines how the audience perceives it. It has to be clear and transparent. Accurate data, in combination with precise design, make your report tell a story.
STEP 5 Delve into Detailed Metrics
Observing far-going goals and overall perspectives is helpful for strategic insights. However, you should pay attention to short-term monitoring and specific details. This helps you to detect performance bottlenecks and understand your strengths and weaknesses.
STEP 6 Utilize Multiple Dashboards
Salesforce produces the all-embracing data. Sometimes, it is helpful to split your data into multiple dashboards. Or you can use several dashboards to display the same data from another perspective.
STEP 7 Create a Visual Narrative:
You should use logic in your data and visual illustrations. Your report must be consistent. All the points, goals, KPIs, and dashboards in your Salesforce report should flow logically and lead to a reasonable conclusion.
STEP 8 Provide Broad Data Accessibility
Enhance the report with flexibility. Divide dashboards for specific audience roles and make the report available online 24/7. Ensure your Salesforce report works on different devices.
STEP 9 Consider Both Immediate and Future Implications
You should include historical data and future prognosis in your report with real-time analytics.
STEP 10 Monitor, Evaluate, Tweak, and Iterate
You should track the relevance of your report. Evaluate its effectiveness. It is helpful to ask your report audience for feedback occasionally. And make adjustments according to the results you get. This way, your Salesforce report will be continuously improved.
How Skyvia Enhances Your Salesforce Reporting Experience
It seems like we have covered all the possible subtleties on the reporting topic. Yet, there are more ways to enrich reporting in Salesforce.
To get data from sources not supported by the mentioned reporting tools, Skyvia is here for you. Skyvia is a cloud platform that performs various data-related tasks.
Haven’t you heard about Skyvia yet? Register now and get acquainted with Skyvia’s features.
Most of the reporting tools support various data sources like files, databases, storage services, and more. But when it comes to cloud platforms and tools, their list is quite limited. For instance, Tableau does not support a connection to Stripe. However, Skyvia can help you connect any data source with Tableau in several ways. Skyvia supports nearly 200 various tools to connect to.
Below, we describe how to get data from a source not supported by popular Salesforce analytics tools using Skyvia capabilities. You have several options to do this. With Skyvia, you can export data from a cloud source to a file and then ingest it by the reporting tool. Or you can create a copy of the cloud data source in a database or a cloud data warehouse, like Redshift or Snowflake. This can be useful even for data sources that can be connected directly, like Salesforce, because databases, especially data warehouses, provide much higher performance and flexibility for data analysis.
Another way is to create an OData API layer for your data source and connect reporting tools to your data via OData. Skyvia’s OData endpoints work directly with the source data and support many OData protocol features.
To start leveraging Skyvia, you need an active Skyvia account. Register now and go for an easy ETL, ELT, and Reverse ETL journey.
Exporting Data to a File
As most of the reporting tools support file data sources, Skyvia allows exporting data from a cloud source to a file, putting this file to a storage service. This option is the easiest way to create a report from any cloud data source, even if your analytics tool doesn’t support it.
- Go to Skyvia.
- Click +NEW and select Export to create a new Export integration.
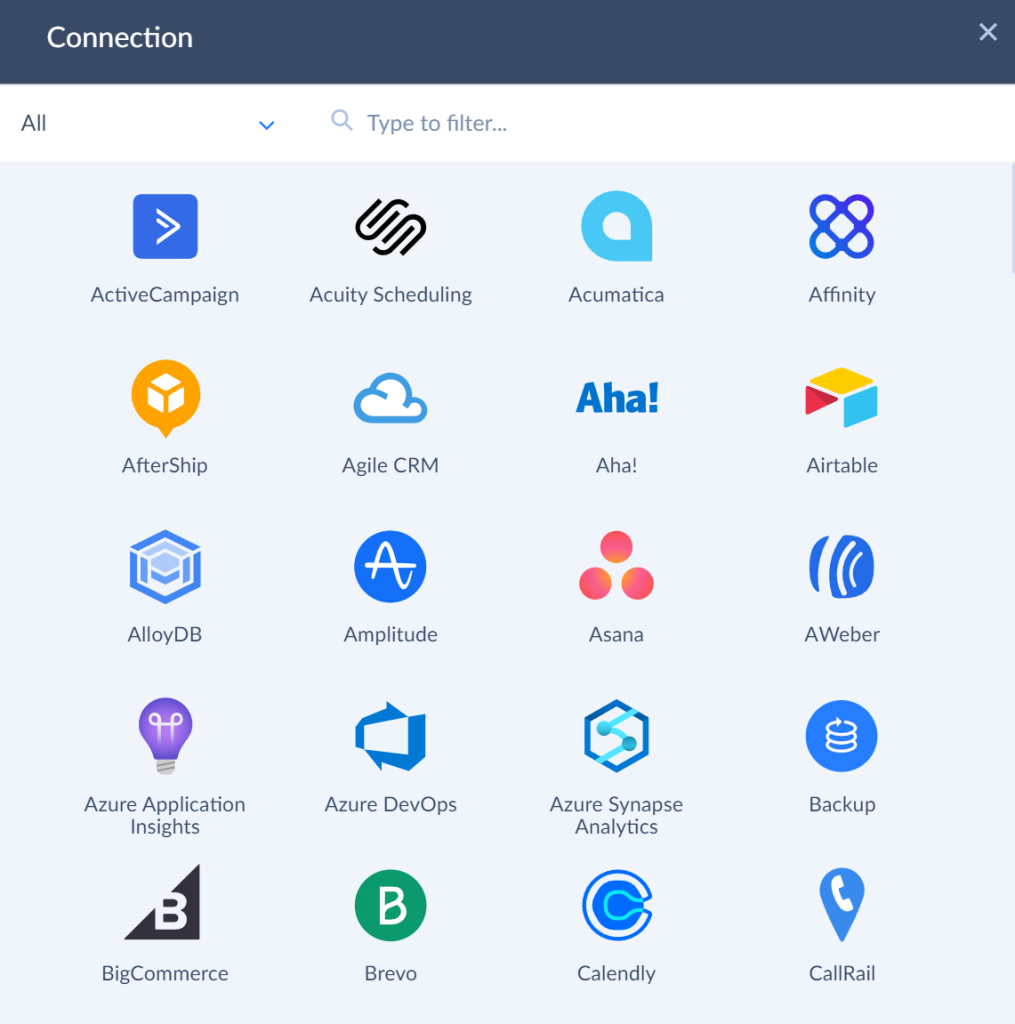
- Select the source. Select the existing connection or create a new one. You can do it directly in the integration editor or create it in advance by clicking the +NEW.
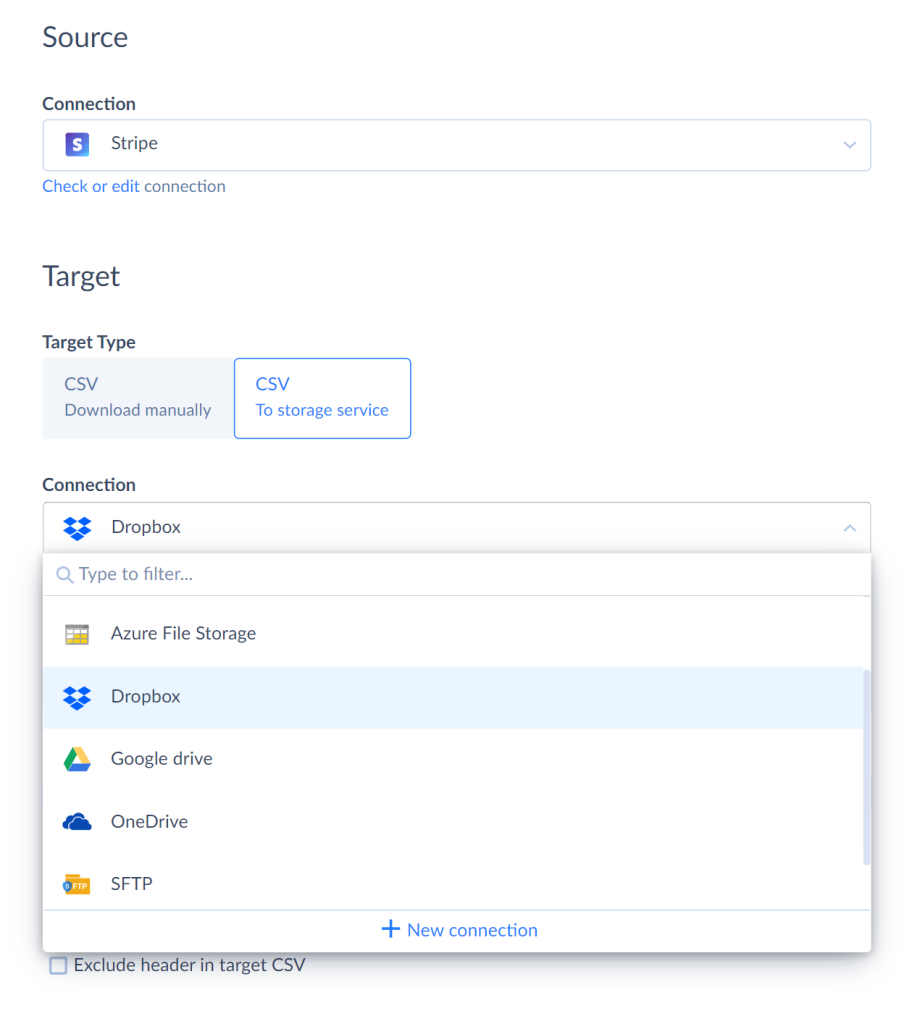
- Set the Target Type. Select CSV Download Manually to get the file manually or CSV To Storage Device to save the file in the storage service. Skyvia supports multiple storage services.
- Add the export task by clicking Add new. Export a separate source object or query the data with a custom SQL command in the Advanced Task Mode. Name the file and adjust the fields’ order and names.
- Save the integration and run it.
When the run is completed, you get the new file in your storage, ready to be processed by your reporting tool.
Creating Cloud Data Source Copy in the Database
If working with files is not an option for your business needs, Skyvia offers another approach to accessing the data in unsupported data sources. Reporting tools support various databases and data warehouses. So, another Skyvia data integration tool, Replication, creates a copy of your cloud source data in a database or a data warehouse. You can directly access this database from your reporting tool.
To replicate the cloud data to a database, perform the following steps.
- Go to Skyvia.
- Click +NEW and select Replication.

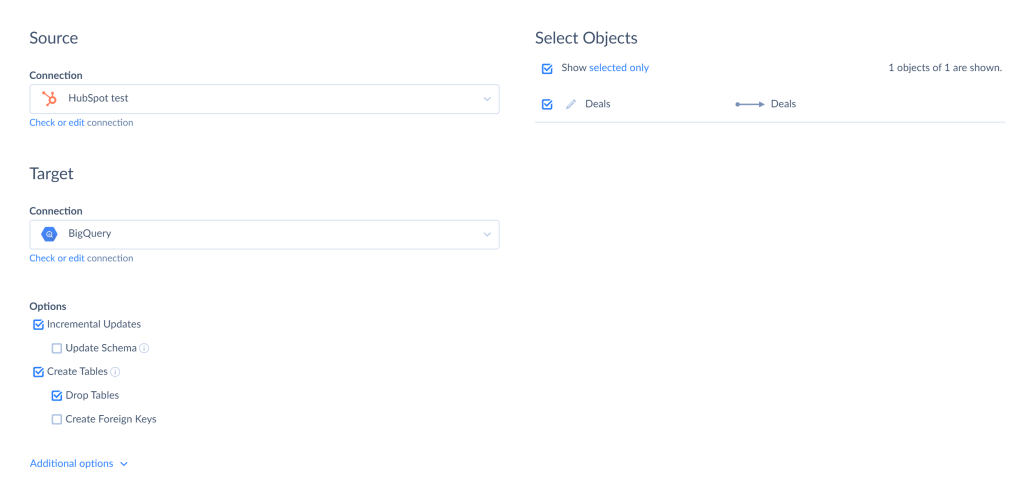
- Select the cloud app as a Source and a database or a data warehouse as a Target. You can create connections in advance or do it directly in the integration editor.
- Select the objects you want to replicate.
- Save the integration and run it.
As a result, your cloud app data is available for your reporting tool in your database. Moreover, Skyvia can keep the database up-to-date by applying updates from the source automatically.
Getting Real-time Data With Skyvia
There is another alternative to connect to an unsupported data source using Skyvia. Skyvia can provide real-time access to almost any cloud data source using OData. Popular reporting tools, such as Tableau, support direct connections via OData. You create an OData endpoint to your cloud app in Skyvia and use this endpoint as a data source in your reporting and analysis tool.
You just connect to the cloud data source in Skyvia, create an OData endpoint, and follow the wizard instructions.
After that, you connect to this endpoint from the reporting tool and enjoy real-time data access.
Wrapping Up Salesforce Reporting Insights
Good reporting is essential for evaluating business effectiveness. Salesforce reporting is a complicated process that demands a lot of effort. There is a variety of report types in Salesforce. And there are lots of tools designed to simplify and optimize the reporting process. The top five tools are the following: built-in Salesforce reporting tool, Klipfolio, Tableau, Smartsheet, and G-Connector. Every tool has its own features and benefits. Most of them offer visualization, customization, and advanced analytics capabilities. They all support direct connection with Salesforce and ease the pain of creating powerful reports.
Besides a good reporting tool that does calculations and visualizes your data, there is also work for you. We listed ten helpful reporting tips that can help you to build an excellent report.
Despite the popular Salesforce reporting tools capabilities, there is still room for improvement. The mentioned reporting tools may not support some cloud data sources or offer limited opportunities for data integration and consolidation. There is a solution to these problems.
Skyvia provides ETL, ELT, and reverse ETL solutions for various data-related tasks. It can help you with access to the cloud apps that you can’t access directly from a reporting tool. With Skyvia, you can export data to a file and ingest this file in your reporting tool. Skyvia Replication allows getting a copy of cloud app data to a database supported by a reporting tool and providing better performance for data analysis. Moreover, with Skyvia, you can have real-time access to any cloud app from your reporting tool using OData.
Don’t hesitate to register in Skyvia and explore various opportunities for data management and reporting.