(1)")
Summary
- Microsoft Fabric Community Conference 2026 (FabCon): The go-to event for teams working with Microsoft Fabric, Power BI, and the modern Microsoft analytics stack.
- Tableau Conference 2026 (TC26): Still the flagship event for data visualization practitioners, with deep dives into dashboard design, storytelling, and real-world use cases.
- Qlik Connect 2026: A strong mix of product updates, customer stories, and practical sessions around analytics, AI, and data-driven decision-making.
- IEEE VIS 2026: The leading academic conference for cutting-edge research in data visualization, visual analytics, and human–data interaction.
- EuroVis 2026: Europe’s premier visualization conference, blending applied industry work with high-quality research and design-focused talks.
Data visualization is changing fast, and 2026 is lining up to be a real inflection point. We’re moving into a phase where generative AI meets dashboarding, where:
- Charts explain themselves.
- Insights come with context.
- Analysis feels more like a conversation than a report.
That’s exactly why it makes sense to start planning your 2026 conference calendar now. Budgets need lead time, early-bird tickets don’t last, and if you’re traveling internationally, visas can quietly become the longest pole in the tent. A little foresight here goes a long way.
The conferences below are where teams are sharing what’s actually working, what’s still rough around the edges, and how AI-driven visualization is moving from demos into real products.
One last thing to keep in mind as you read the list. Visualization may be just the part everyone talks about, but it’s only the tip of the iceberg. Under every impressive dashboard is a much larger foundation of data integration and plumbing.
That hidden layer (moving, syncing, and preparing data) is what makes modern visualization possible in the first place, and it’s the piece tools like Skyvia focus on behind the scenes.
Table of Contents
- Quick Look: The 2026 Conference Calendar
- Top Vendor Conferences (BI & Analytics)
- Strategic Leadership Summits
- Why Data Integration is the Secret to Great Visualization
- Tips for Getting Your 2026 Trip Approved
- Conclusion
Quick Look: The 2026 Conference Calendar
| Event Name | Date | Location | Primary Focus (Vendor / Academic / Design) |
|---|---|---|---|
| Microsoft Fabric Community Conference (FabCon) 2026 | TBD (2026) | Las Vegas, USA | Vendor |
| Tableau Conference (TC26) | TBD (2026) | USA (city TBD) | Vendor |
| Qlik Connect 2026 | TBD (2026) | USA (city TBD) | Vendor |
| IEEE VIS 2026 | Oct–Nov 2026 (TBD) | USA (city TBD) | Academic |
| Outlier 2026 (Data Visualization Society) | TBD (2026) | USA (city TBD) | Design |
| EuroVis 2026 | June 2026 (TBD) | Europe (city TBD) | Academic |
| Gartner Data & Analytics Summit 2026 | TBD (2026) | USA / Europe (multiple editions) | Vendor |
| Data Innovation Summit (Stockholm) 2026 | May 2026 (TBD) | Stockholm, Sweden | Vendor |
Top Vendor Conferences (BI & Analytics)
Vendor conferences are where analytics platforms show where they’re really headed. This is where product teams talk openly about roadmaps, AI features get demoed before they hit production, and customers share what actually works at scale. If you want to understand how engineering, analytics, and visualization are converging in real life, these events tend to deliver the most practical takeaways.
Microsoft Fabric Community Conference 2026 (FabCon)
Expected: March 2026 – Las Vegas or Atlanta, USA
FabCon has effectively replaced the old Power BI–only events and grown into a full-scale Microsoft Fabric conference. It’s all about how engineering, analytics, and visualization come together inside Fabric, with OneLake acting as the shared foundation.
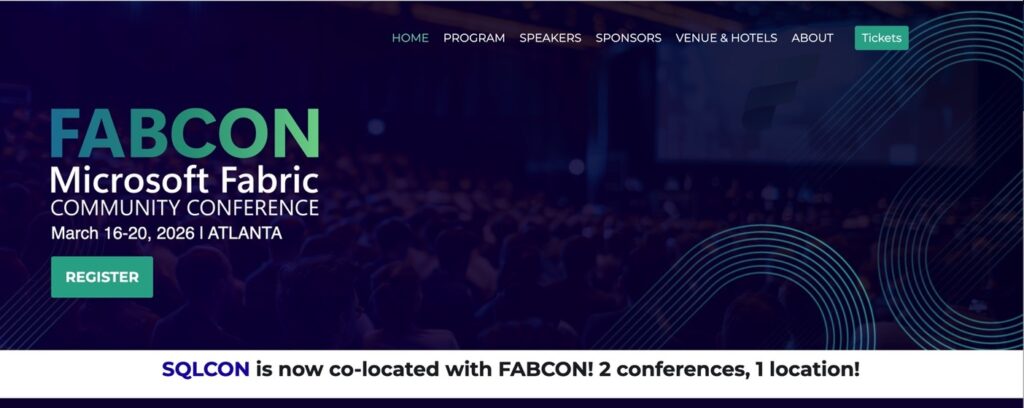
Expect deep dives into unified pipelines, real-time analytics, and how Power BI fits into a broader data platform story. For teams working with external systems, this is also where loading information into OneLake becomes a real conversation, including scenarios where tools like Skyvia help bring it in from SaaS apps, databases, and warehouses without building custom ingestion pipelines.
Tableau Conference 2026 (TC26)
Expected: Spring 2026 – San Diego or Las Vegas, USA
Tableau Conference remains one of the most community-driven events in the BI world. Iron Viz still steals the spotlight, but the real value comes from DataFam sessions where practitioners walk through real dashboards, real mistakes, and real lessons learned.
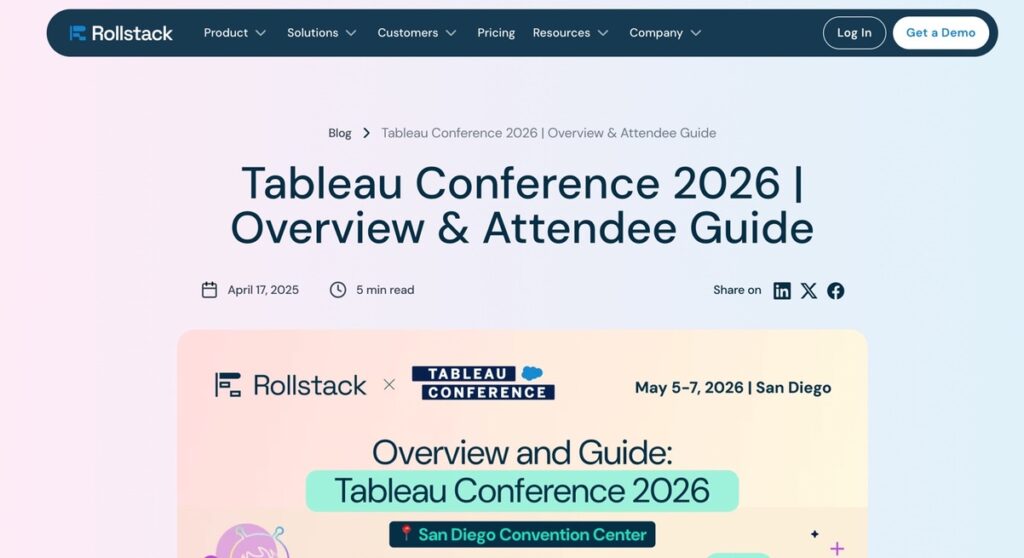
With Tableau firmly part of Salesforce, TC26 continues to lean into CRM analytics, cross-cloud data, and storytelling at scale. It’s especially relevant for teams working with Salesforce data or blending multiple sources, assuming there’s a solid integration layer in place keeping Tableau fed with fresh, reliable information.
Qlik Connect 2026
Expected: April or May 2026 – Orlando, Florida, USA
Qlik Connect has become increasingly AI-centric, with a strong focus on augmented analytics and machine-assisted insight discovery. Expect a lot of discussion around how Qlik uses AI to surface patterns and anomalies without forcing users to dig through dashboards manually.
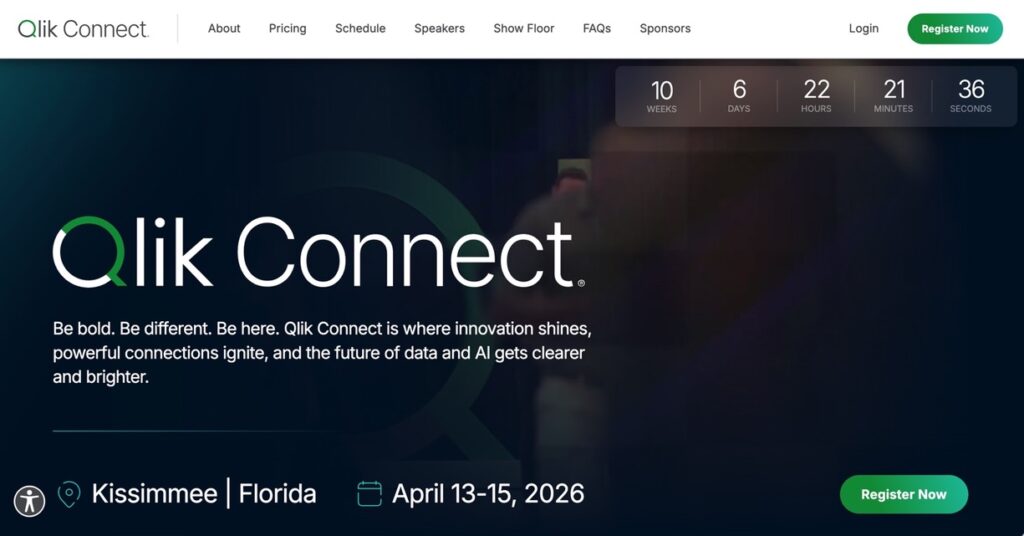
Beyond the AI angle, Qlik Connect is also valuable for teams dealing with complex data models and hybrid environments. Many sessions focus on preparing and shaping data before it ever reaches the analytics layer, which makes it a good fit for anyone thinking seriously about how data gets integrated and governed upstream.
Research & Design-Focused Events
Vendor conferences are about platforms and roadmaps. These events are about thinking, where visualization theory, design craft, and human perception take center stage. You won’t hear much about product features or licensing tiers here, but you’ll come away with sharper instincts about how people actually read, interpret, and trust data.
IEEE VIS 2026
Expected: October–November 2026 – Location TBA
IEEE VIS is the heavyweight research conference in the data visualization world. It brings together academics, researchers, and advanced practitioners to explore how visual systems work, how people interact with them, and where visualization is heading next.
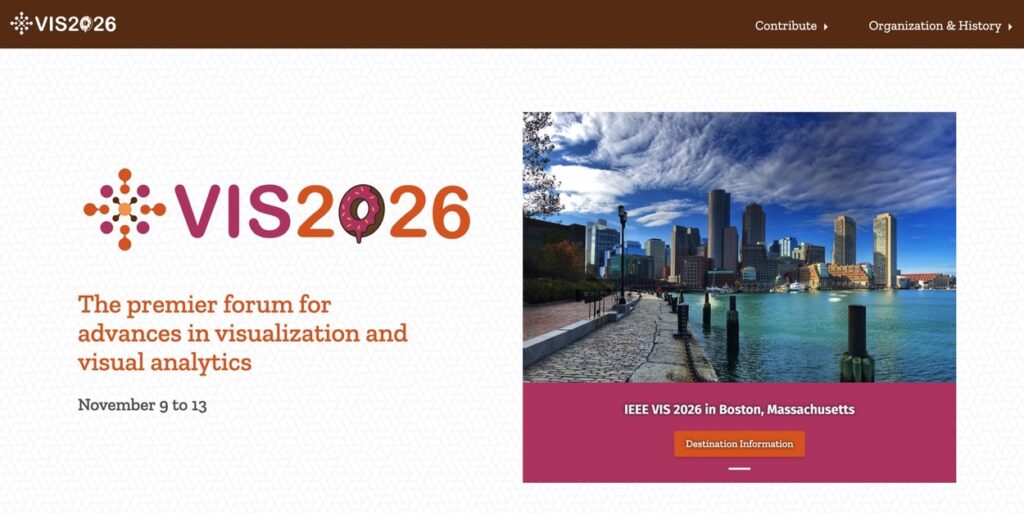
The content can get technical, but it’s incredibly valuable if you care about chart perception, visual cognition, explainability, or AI-assisted visualization. Many ideas that later show up in commercial BI tools tend to appear here first, years earlier, in paper form.
Outlier 2026 (Data Visualization Society)
Expected: 2026 – Location TBA
Outlier is the heart of the modern data visualization community. Unlike BI conferences that focus on tools, Outlier is about design, storytelling, ethics, and the craft of turning data into something people actually understand.
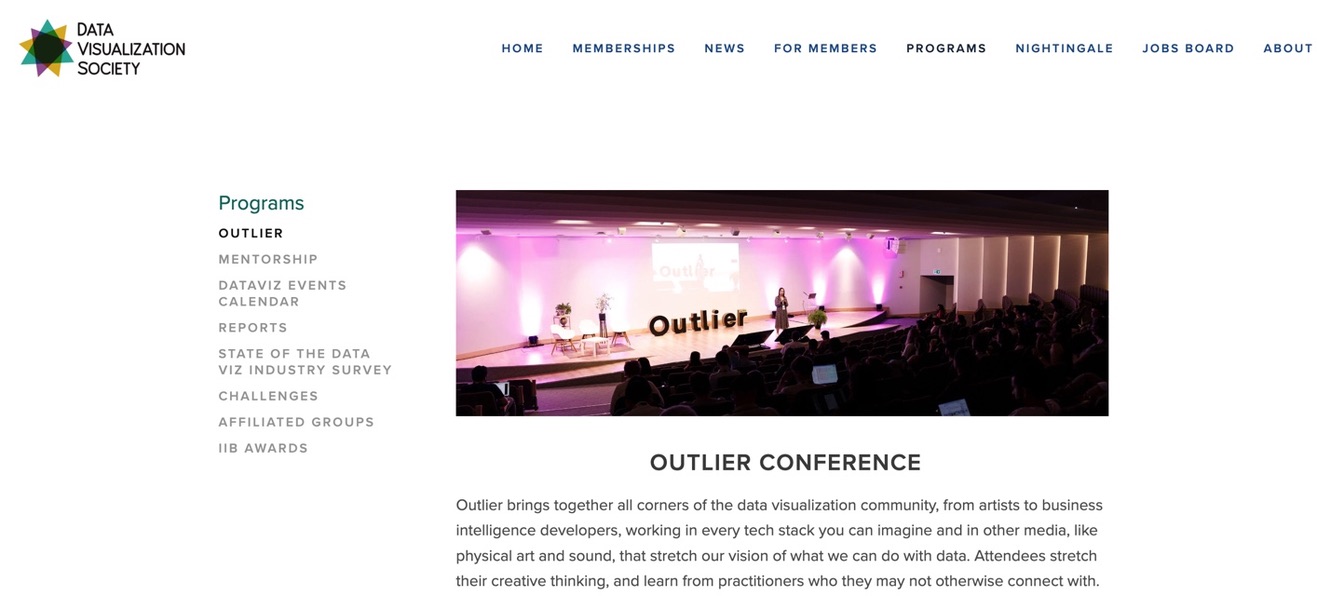
You’ll find journalists, designers, analysts, and educators sharing work that sits at the intersection of data and human experience. If you care about clarity, honesty, and impact in dashboards and reports, this is one of the most inspiring events you can attend.
EuroVis 2026
Expected: June 2026 – European city (TBA)
EuroVis is the leading European conference on visualization research and visual analytics. It covers a wide range of topics, from interactive visualization techniques to applied visual analytics in science and industry.
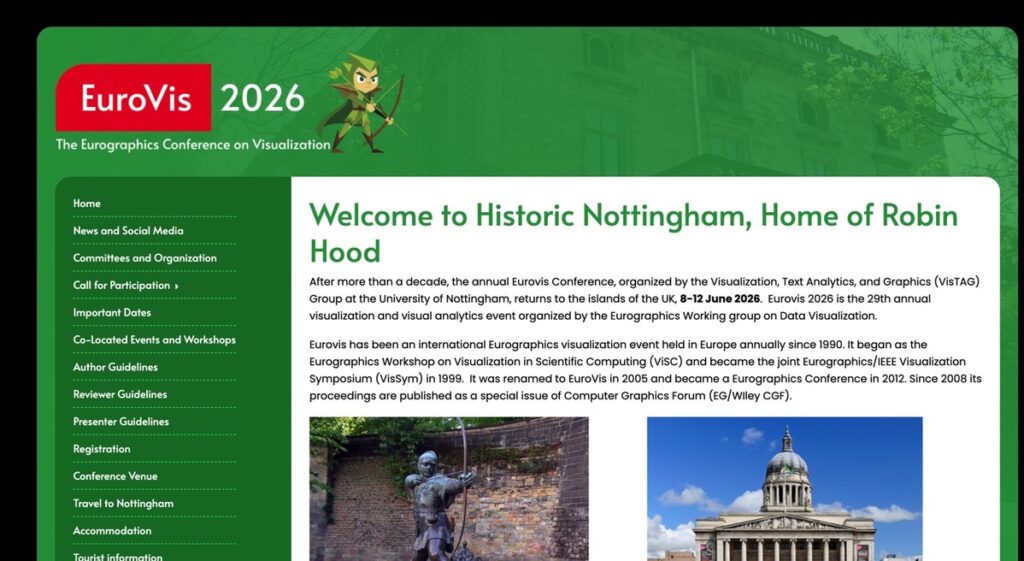
For teams working in Europe – or anyone based closely with EU data ecosystems – EuroVis offers a strong mix of academic depth and practical relevance. It’s also a great place to see how visualization research is applied outside the typical US-centric BI ecosystem.
Strategic Leadership Summits
These events are less about charts, tools, or new features and more about decisions. This section is where data leaders step back from day-to-day execution and focus on:
- Strategy.
- Governance.
- Organizational maturity.
- Long-term value.
If you’re shaping a data roadmap rather than building dashboards yourself, this is the room to be in.
Gartner Data & Analytics Summit 2026
Expected: March 2026 – Orlando, USA
The Gartner Data & Analytics Summit is one of the most influential events for senior data leaders. It’s designed for CDOs, heads of analytics, and managers who need to connect data strategy with business outcomes.
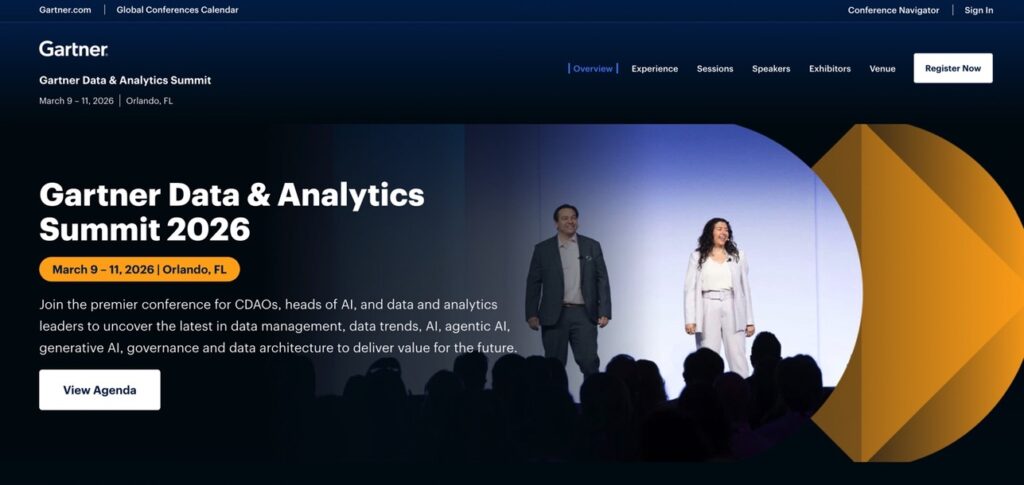
Sessions focus on operating models, governance, AI readiness, data products, and scaling analytics across the organization. It’s less tactical and more directional, which makes it especially useful when you’re making budget decisions or planning multi-year initiatives rather than choosing tools.
Data Innovation Summit 2026 (Stockholm)
Expected: May 2026 – Stockholm, Sweden
The Data Innovation Summit has grown into one of Europe’s largest data and analytics events, blending strategy, technology, and real-world case studies. Compared to Gartner, it’s more hands-on and practitioner-friendly, with strong representation from engineering, analytics, and business teams.
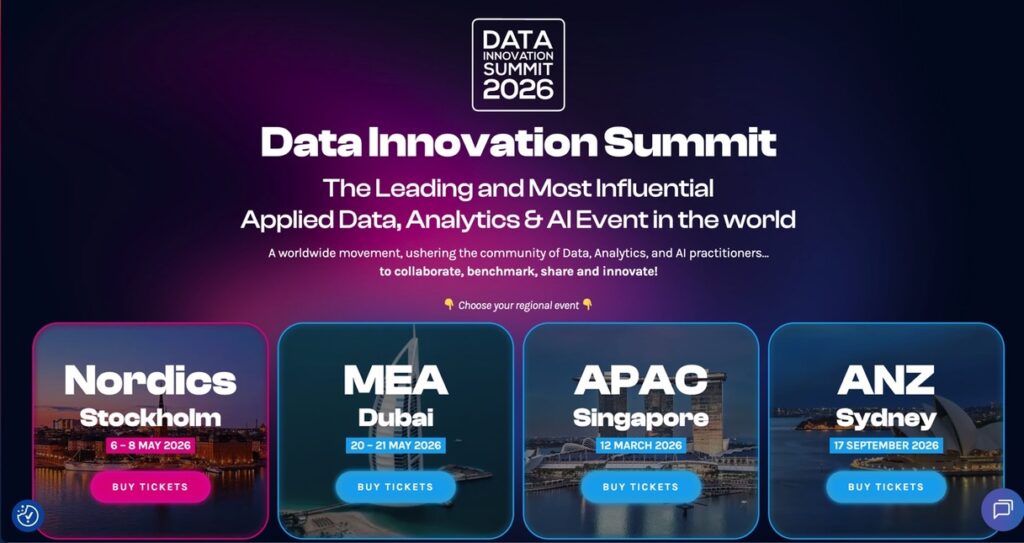
For European organizations in particular, it’s a great place to see how data, AI, and analytics are being applied at scale across industries, without the heavy enterprise consulting lens. It strikes a good balance between vision and execution.
Why Data Integration is the Secret to Great Visualization
You can’t visualize what you can’t reliably access. All the AI features in the world won’t help if the data behind the charts is late, incomplete, or stitched together from half-working sources. Insufficient data doesn’t just lead to ugly dashboards. It quietly undermines trust in everything built on top of them.
That’s why most data visualization conferences spend so much time talking about AI, storytelling, and interactivity, but the real work usually happens earlier. Natural language queries, anomaly detection, and predictive insights all depend on one thing: clean, consistent, well-prepared data coming from multiple systems. If those pipelines are fragile or manual, even the smartest AI ends up amplifying the mess.
Modern BI tools like Tableau and Power BI are getting better at helping users explore data in real time, build interactive dashboards, and surface insights faster. But they assume the data is already there, structured, and ready to go. When it isn’t, teams end up debugging connectors instead of experimenting with visuals or learning new design techniques.
Here, data integration becomes the quiet foundation of great visualization. Using tools like Skyvia Import and Replication, teams can automate data pipelines in advance and stop worrying about whether CRM, finance, or product data will be available when needed.
Think of it as pre-conference prep for your data stack: get the pipelines running smoothly before you dive into sessions about AI-powered dashboards and advanced design patterns.
Tips for Getting Your 2026 Trip Approved
Most managers don’t say “no” to conferences because they dislike learning. They dislike a $1,500–$2,000 ticket plus travel needs with a clear return. The good news is that data visualization conferences are actually easy to justify if you frame them the right way.
Start with ROI, not excitement. Instead of pitching the event as “a great learning opportunity,” be specific about outcomes.
For example: I’ll bring back three clear dashboard design patterns we can apply to our exec reports, or I’ll evaluate two new BI features we’re considering for next year.
When you tie the trip to deliverables, it stops sounding like a perk and becomes an investment.
Networking is another angle that decision-makers understand well. In-person events are still one of the fastest ways to build useful relationships.
Bring business cards, polish your LinkedIn profile, and actually plan whom you want to talk to:
- Partners.
- Vendors.
- Peers solving similar problems.
A couple of solid conversations can save weeks of trial and error back at work.
It’s also a good idea to visit such conferences because they are the places where industry trends show up before they hit blog posts. Hearing directly from BI vendors, data leaders, and researchers helps you separate hype from what’s actually shipping and usable. That insight alone can prevent expensive tooling mistakes later.
Finally, connect the dots back to your data stack. Great dashboards rely on clean, well-prepared data. Many teams now use no-code data integration tools like Skyvia to automate data prep before events so they can focus on learning visualization techniques instead of fixing pipelines.
Conclusion
Data visualization itself is already a breakthrough phenomenon in the IT industry. It has come a long way, and 2026 is shaping up to be a big year for anyone working with analytics, BI, or data storytelling.
As the industry evolves, new approaches and trends in data visualization appear. To be the first to discover them, consider attending conferences. Get ready in advance by exploring the data visualization trends and planning your trip.
Take advantage of the networking opportunities and experience sharing during the conference. This will help to lead your business ahead of competitors and gain success in the market.
So plan your year, pick the events that make sense for your role, and ensure the data stack is ready to support what you’ll learn.
Before you build that award-winning dashboard, ensure your data pipeline is solid.
Try Skyvia for free to integrate your data sources into Tableau or Power BI effortlessly.
F.A.Q. for Best Data Visualization Conferences

How much should I budget for a data analytics conference in 2026?
Plan for roughly $2,000–$3,000 for a ticket, plus travel and accommodation. All in, most attendees budget between $3,000 and $5,000 depending on location and how early they book.
Are there virtual or hybrid data visualization conferences in 2026?
Yes. Many conferences still offer virtual or hybrid passes, especially for keynotes and workshops. They’re cheaper and easier to attend, though you’ll miss some of the in-person networking.
What is the difference between IEEE VIS and the Tableau Conference?
IEEE VIS is research-focused, diving deep into theory, algorithms, and academic work. Tableau Conference is practitioner-driven, centered on dashboards, design, real-world use cases, and the DataFam community.
How do I justify the cost of attending a conference to my manager?
Frame it around ROI: what skills you’ll learn, how they apply to current projects, and what you’ll bring back. Saying “I’ll return with three actionable ideas we can use immediately” goes a long way.