Data reporting tools are like the dashboard of a car. They give users all the information needed to steer their businesses in the right direction.
Imagine you’ve got tons of raw data from sales figures, customer feedback, website analytics, etc. On their own, these data points are just numbers on a page. Running this data through a reporting tool consolidates it into a single view to help users create detailed reports ranging from simple tables and charts to more complex, interactive dashboards, allowing to:
- Spot trends
- Identify issues
- Uncover opportunities
So, let’s discover the data reporting tool types and their benefits and walk through the top solutions in 2025.
Table of contents
- Main Types of Reporting Tools
- Benefits of Using Data Reporting Tools
- Criteria for Selecting the Best Reporting Tools
- Top Data Reporting Tools for Better Project Visibility
- Final Thoughts on Choosing the Best Reporting Tool
Main Types of Reporting Tools
The table below summarizes the main types of reporting tools, each serving different user’s needs, from strategic decision-making to day-to-day operations.
| Tool Type | Description | Examples |
|---|---|---|
| Business Intelligence (BI) Visualization Tools | BI tools are comprehensive platforms that help organizations collect, analyze, and present business data. They focus on transforming raw data into visual formats like charts, graphs, and maps. They often include features for data warehousing, advanced analytics, and reporting, providing a full suite of tools to support decision-making across the enterprise. | Power BI, Tableau, and QlikView. |
| Ad Hoc Reporting Tools | Ad Hoc reporting tools allow users to create reports on the fly without relying on pre-built templates or IT support. These flexible tools empower business users to generate custom reports to answer specific questions as they arise. | Looker and Microsoft Power BI. |
| Embedded Reporting Tools | Embedded reporting tools integrate reporting and analytics capabilities directly into other software applications. This allows users to access reports and insights within the context of the software they are already using, improving workflow and decision-making efficiency. | Sisense and Domo. |
Benefits of Using Data Reporting Tools
Numbers are always more honest than words are. So, let’s allow numbers to speak.
- According to Gartner, 85% of Fortune 500 companies will use scalable data analytics tools by 2025 to manage their growing data needs.
- Collaboration and Sharing
- Data reporting tools facilitate easy sharing and collaboration, enabling teams to work together more effectively and ensuring everyone can access the same data.
- Statistics. Companies prioritizing collaborative reporting see a 30% increase in project success rates.
- Better Data Accuracy
- Automated data reporting tools reduce the risk of human error, leading to more accurate and reliable reports.
- Statistics. Organizations using automated reporting tools experience a 40% decrease in data errors.
- Criteria for Selecting the Best Reporting Tools
- Choosing the right reporting tool to make a business successful can feel like picking the perfect gadget. There are many options, and the best choice depends on each company’s needs.
- We selected three key criteria to consider. Forrester states that businesses using real-time analytics can see a 5% to 10% increase in operational efficiency. It might seem like a small number, but from a future perspective, it means a lot.
- Deloitte researched that organizations using data visualization tools are 28% more likely to find the information they need and 25% more likely to achieve higher ROI on analytics investments.
- According to McKinsey, companies that use automated data reporting tools show a 50% reduction in time spent on data-related tasks.
- Harvard Business Review says data-driven companies are 5% more productive and 6% more profitable than their competitors. In business terms, it means that the future is theirs.
- A survey by PwC found that companies using data reporting tools are three times more likely to achieve above-average business performance.
- Forester also says businesses that customize their data reports are 60% more likely to meet their performance targets.
Criteria for Selecting the Best Reporting Tools
Choosing the right reporting tool to make a business successful can feel like picking the perfect gadget. There are many options, and the best choice depends on each company’s needs.
We selected three key criteria to consider.
- User-Friendliness. Robust reporting tools should be easy to use, even for those who aren’t data experts. Look for tools with intuitive interfaces, drag-and-drop functionality, and clear instructions. The easier it is to navigate, the quicker users can start making data-driven decisions without getting bogged down by a steep learning curve. Also, consider the community, tutorials, video channels, etc., that might be helpful.
Tip. Try out tools that offer free trials or demos to see if they fit well with your team’s skill set and workflow.
- Customization Options. Each business is unique, so the reports should be too. Customization options provide tailoring reports highlighting the most important data to companies’ goals. Whether customizing dashboards, setting up specific KPIs, or creating unique visualizations, a tool with strong customization features can help users get the insights that matter most.
Tip. Look for tools to create custom templates, filters, and visualizations to match your business’s needs.
- Integration Capabilities. The reporting tool should play nicely with other software that organizations already use. Strong integration capabilities ensure that all data flows seamlessly into the reports, whether CRM, ERP, marketing automation platform, etc. Such an approach saves time and improves data accuracy by eliminating manual data entry.
Tip. Check whether the tool supports integration with the existing systems and offers API access for custom integrations. Data integration platforms like Skyvia, Zapier, MuleSoft, Talend, etc., become the game changers in this step. Each of them is robust enough for appropriate tasks. For example, Skyvia supports 190+ integrations with popular databases, cloud apps, and CRM systems. It may connect Google Analytics, HubSpot, Salesforce, or other systems, ensuring data flows smoothly into your reporting tools without any hitches. The platform is in the top three list of 20 user-friendliest ones according to the last G2 Crowd rate and doesn’t require extensive technical knowledge to set it up.
Top Data Reporting Tools for Better Project Visibility
Here’s a quick overview of the top 10 data reporting tools, focusing on their key features, challenges, pricing, and what users say.
Tableau
Tableau is a powerhouse with its drag-and-drop interface, allowing users to create stunning, interactive visualizations. It supports various data sources and is known for its robust analytics capabilities. Tableau makes it easy to turn complex data into actionable insights without depending on the users’ skills. Plus, its visual storytelling features help businesses present their findings in a way that everyone can understand and act on.
Challenges
It has a steep learning curve for beginners, and some users find it pricey for smaller teams.
Pricing Plans
Pricing starts at $115/month per user for the Creator plan. There are also options for $35 for Viewer and $70 for Explorer roles, making it flexible depending on users’ needs.
Users’ Feedback
Users love its visual capabilities but note that it might be overkill for simple reporting needs.
- G2 Rating 4.4/5 (Over 2,120 reviews)
- TrustRadius Rating 8.9/10 (Over 1,400 reviews)
- Capterra Rating 4.6/5 (Over 1,600 reviews)
Power BI
Power BI integrates natively with Microsoft products. So, it’s the number one choice for those with Microsoft as the backbone of their data stack. It’s strong in data visualization and has AI-powered analytics. Its ability to handle large datasets makes it a powerful tool for large enterprises.
Challenges
There is a steep learning curve for those diving into advanced features because the interface could be clearer.
Pricing Plans
Power BI Pro starts at $9.99 /month per user. There’s also a free version with limited features.
Users’ Feedback
The solution is highly praised for its value and integration with Microsoft tools. However, it can be challenging for non-technical users at first.
- G2 Rating 4.4/5 (Over 1,1300 reviews)
- TrustRadius Rating 8.4/10 (Over 2,300 reviews)
- Capterra Rating 4.6/5 (Over 1,700 reviews)
Coupler.io
Coupler.io is a reporting automation platform with AI features focusing on marketing, sales, and financial reports. This tool offers in-app dashboards as well as helps automatically bring cross-channel business data into Looker Studio, Power BI, Tableau, spreadsheets to craft live reports.
Using their pre-defined templates, like an accounting dashboard and others, is a good option to start with data reporting.
Challenges
Some users report on complexities in the setup from scratch, requiring efforts to use the tool at full capacity.
Pricing Plans
Pricing starts at $24 per month, providing a set of plans for different team sizes and needs.
Users’ Feedback
Many users enjoy Coupler.io’s data transformation features and multi-channel reports, while some admit its steep learning curve.
- G2 Rating: 4.8/5 (76 reviews)
- TrustRadius Rating: 10/10 (2 reviews)
- Capterra Rating: 4.9/5 (82 reviews)
Domo
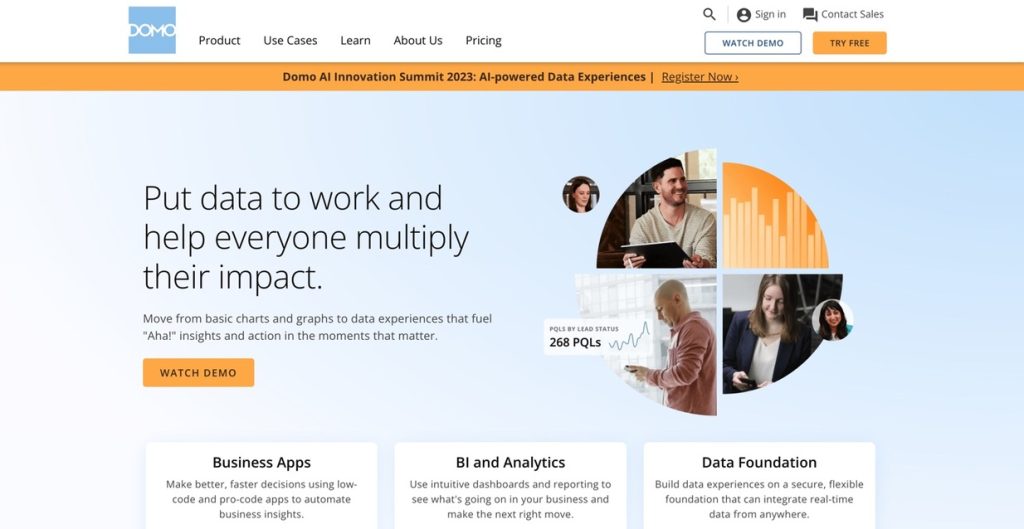
Domo is an all-in-one platform that combines BI with collaboration tools. It’s robust in real-time data visualization and has many connectors for different data sources. Domo’s user-friendly interface makes it easy for teams to collaborate and share insights across the company.
While its extensive feature set can be overwhelming initially, it’s a powerful tool for businesses looking to centralize their data and make informed decisions quickly.
Challenges
The cost can be too expensive, especially for smaller companies.
Pricing Plans
Pricing is customized based on the number of users and data integrations, so requesting a quote is better.
Users’ Feedback
Domo users love the range of data connectors and real-time dashboards but often mention the high cost and complexity of the platform.
- G2 Rating 4.2/5 (Over 790 reviews)
- TrustRadius Rating 8.6/10 (Over 300 reviews)
- Capterra Rating 4.3/5 (Over 100 reviews)
Looker Studio
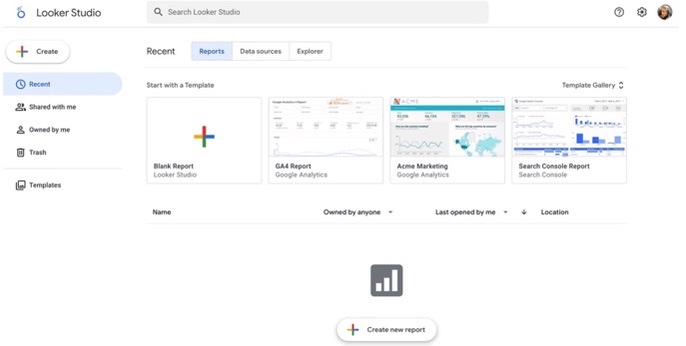
Looker Studio (formerly Google Data Studio) is an open-source, popular Google ecosystem tool that makes creating custom dashboards and reports easy, especially for companies already using other Google products like Google Analytics. Its user-friendly interface is great for quick insights without a steep learning curve. While it may not have all the advanced features of some paid tools, its seamless integration with Google services and zero-cost access make it a go-to choice for small to mid-sized businesses.
Challenges
It’s not as feature-rich as some paid tools, and it might not handle large datasets as smoothly.
Pricing Plans
It’s a free solution.
Users’ Feedback
Users love its simplicity and seamless integration with Google tools. However, it can be limited in terms of advanced features and handling large datasets.
- G2 Rating 4.3/5 (Over 420 reviews)
- TrustRadius Rating 8.3/10 (Over 50 reviews)
- Capterra Rating 4.5/5 (Over 320 reviews)
Zoho Analytics
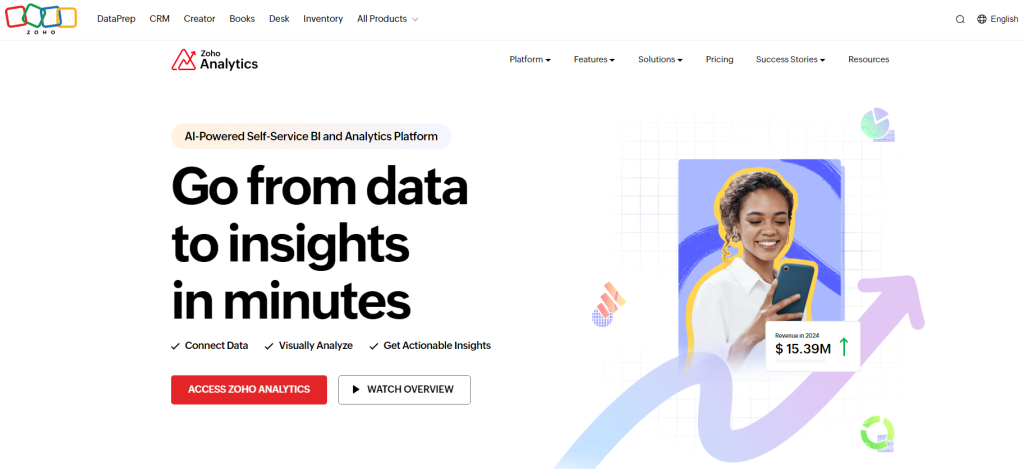
Zoho Analytics is a versatile BI tool focused on easy-to-use dashboards and AI-powered analytics. It integrates well with the rest of the Zoho suite. This approach makes it a good choice for businesses already using Zoho’s CRM, finance, or HR tools. While it’s designed to be user-friendly, Zoho Analytics also offers powerful features for deeper data analysis, making it a solid option for both beginners and experienced analysts. Its affordability and seamless integration within the Zoho ecosystem make it a popular choice for growing businesses.
Challenges
Some users report that it can be slow with large datasets, and the interface isn’t as polished as some competitors.
Pricing Plans
Starts at $24 per month for two users, with various plans depending on users’ needs.
Users’ Feedback
Users mostly like Zoho Analytics for its affordability and ease of use, especially within the Zoho ecosystem. However, some find it less powerful when dealing with large, complex datasets.
- G2 Rating 4.3/5 (Over 300 reviews)
- TrustRadius Rating 8.2/10 (Over 80 reviews)
- Capterra Rating 4.4/5 (Over 300 reviews)
Sisense
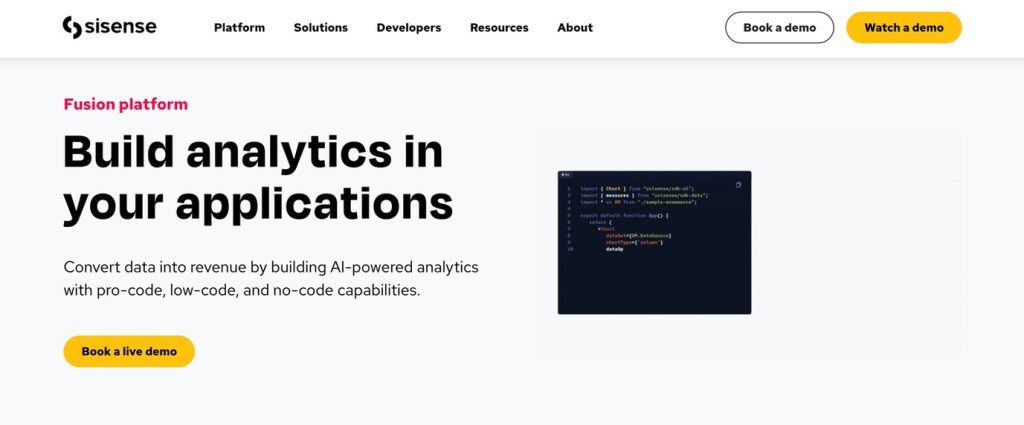
Sisense is known for its ability to handle large datasets and complex data modeling. It’s great for embedding analytics into users’ applications. With its powerful data engine, Sisense can quickly process vast amounts of data, making it good for businesses dealing with big data. While the platform is feature-rich and may require some technical expertise to fully leverage, its scalability and flexibility make it a top choice for companies that need robust, customizable analytics solutions. Additionally, its ability to integrate seamlessly with various data sources and tools ensures that users can build a comprehensive analytics environment tailored to their requirements.
Challenges
It’s one of the most expensive options and can be complex to set up and manage.
Pricing Plans
Custom pricing is based on users’ specific needs. Please get in touch with them for a quote.
Users’ Feedback
Users love its scalability and performance with big data but note that it requires significant technical expertise.
- G2 Rating 4.2/5 (Over 1000 reviews)
- TrustRadius Rating 8.4/10 (Over 350 reviews)
- Capterra Rating 4.5/5 (Over 380 reviews)
Qlik Sense
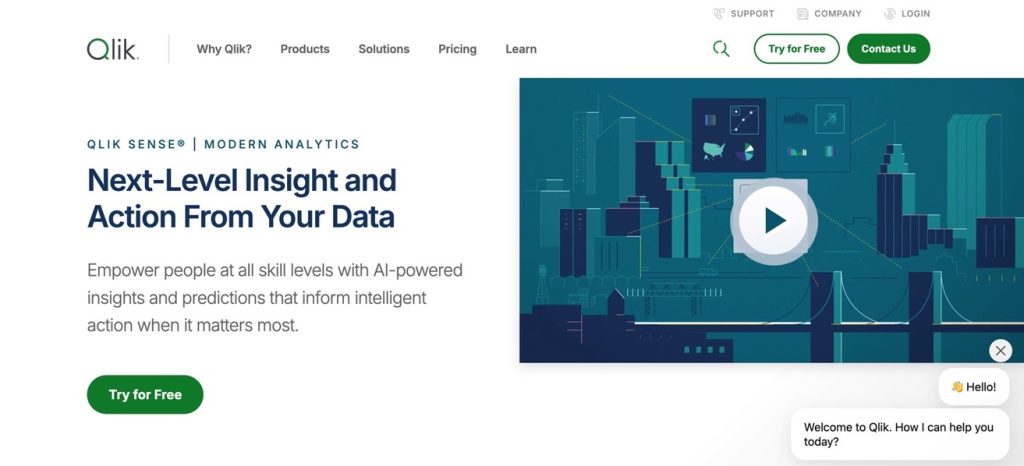
Qlik Sense offers powerful data visualization and self-service analytics. It provides an associative data model, which helps discover hidden insights. This model allows users to explore data freely without the limitations of traditional query-based tools. That makes it easier to uncover connections that might otherwise go unnoticed. Its flexibility and depth of analysis make it a favorite for businesses that want to empower users at all levels to make data-driven decisions.
Challenges
It can be challenging for beginners, and some users find the learning curve steep for advanced features.
Pricing Plans
Pricing plans are flexible and depend on the user’s requirements. There’s also a free version available with limited capabilities.
Users’ Feedback
Users often mention a steep learning curve but also appreciate the depth of analysis it offers.
- G2 Rating 4.5/5 (Over 660 reviews)
- TrustRadius Rating 8/10 (Over 990 reviews)
- Capterra Rating 4.5/5 (Over 257 reviews)
SAP Analytics Cloud
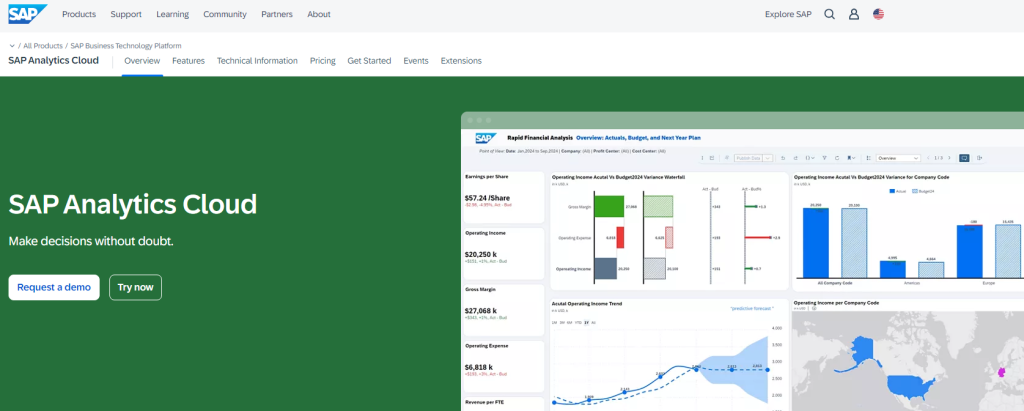
SAP Analytics Cloud combines BI, predictive analytics, and planning in one platform. It’s powerful for those already using SAP products. The platform offers a unified solution that seamlessly integrates with other SAP tools, making it a successful choice for enterprises already invested in the SAP ecosystem. Its comprehensive approach to analytics, including AI-driven insights, makes it a robust option for companies looking to centralize their analytics, planning, and reporting needs in one place.
Challenges
It’s not the most user-friendly tool, especially for users who are new to SAP.
Pricing Plans
Pricing starts at $36/month per user, with plans based on companies’ specific needs.
Users’ Feedback
Users mostly like integrating SAP products and combining BI, planning, and predictive analytics in one tool. However, some find it complex and not very user-friendly.
- G2 Rating 4.2/5 (Over 500 reviews)
- TrustRadius Rating 8.5/10 (Over 800 reviews)
- Capterra Rating 4.4/5 (Over 110 reviews)
IBM Cognos Analytics
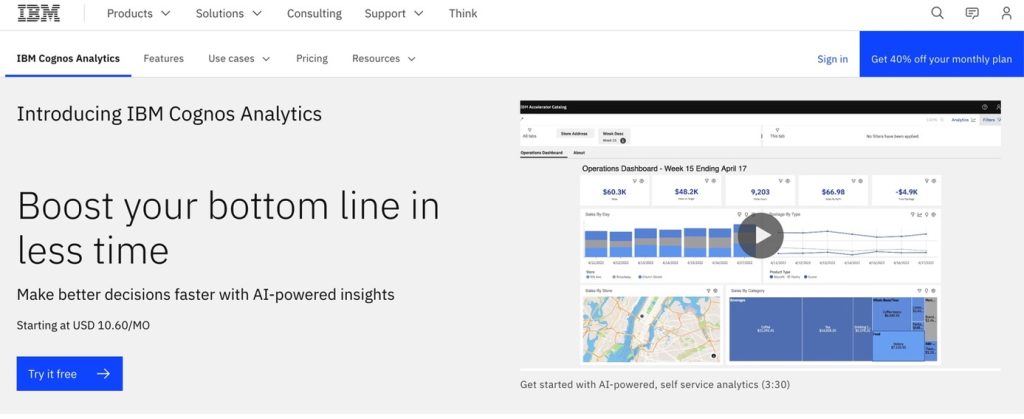
IBM Cognos Analytics offers AI-assisted data exploration and reporting, allowing for easy finding insights from complex data sets. The platform is a go-to solution for businesses with extensive reporting and analytics needs while handling large-scale data challenges. It might have a steeper learning curve, especially for new users. Still, its extensive customization options make it robust for companies that require detailed, enterprise-grade analytics. IBM Cognos also integrates well with other IBM products, providing a cohesive experience for organizations already within the IBM ecosystem.
Challenges
Some users find the interface outdated, and the initial setup can be complex.
Pricing Plans
Pricing starts at $10.6/month per user, with options for different user roles.
Users’ Feedback
Businesses like its powerful analytics capabilities but often mention that the interface could be updated.
- G2 Rating 4.0/5 (Over 370 reviews)
- TrustRadius Rating 8.2/10 (Over 570 reviews)
- Capterra Rating 4.2/5 (Over 139 reviews)
Final Thoughts on Choosing the Best Reporting Tool
Not all reporting tools are created equal. Each platform has strengths and weaknesses, so let’s highlight three key moments to help you make the best choice.
- Company requirements
- Company budget
- User expertise
Before selecting the data reporting tool, define the objectives that will guide the company in choosing the right data, metrics, and report types. It may be tracking sales performance, monitoring customer behavior, measuring marketing ROI, etc. Knowing clear goals will keep such a selection focused and relevant.
For instance, Looker Studio might be perfect for small businesses with simple needs. Tools like Tableau or Power BI might be more appropriate if a company deals with large datasets and requires advanced features. So, evaluate all the options and try a few demos before selection. Ratings and feedback may also give potential users a good sense of how each tool is perceived in the market and how it can solve your organization’s business pains.