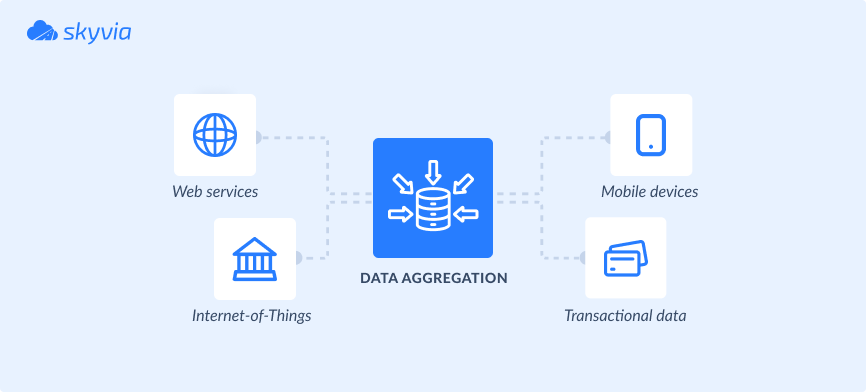
Modern tech stacks usually contain numerous hardware and software components with data scattered across them. Data aggregation helps to bring all that information into a single view. This process resembles a puzzle game, where you must organize hundreds of pieces into a general picture.
Having a general picture of data helps to identify trends and gain insights. You can discover the average age of your audience or cities with the highest sales and get other critical information about your business.
This article explains data aggregation and its application within the organizational environment. It also provides a dozen data aggregation tools for collecting and organizing data.
Table of Contents
- Introduction to Data Aggregation
- Importance of Data Aggregation Tools
- Overview of the Top 10 Data Aggregation Tools
- Comparison of the Data Aggregation Tools
- Criteria for Selecting Data Aggregation Tools
- Final Thoughts
Introduction to Data Aggregation
Let’s first focus on the word aggregation and discover its roots. In Latin, the meaning of aggregation was to group items together. So, when returning to data aggregation, it’s about grouping various kinds of data.
Why is it necessary?
It’s simple. With the growing amount of data, the aggregation process reduces its amount. It also contributes to noise minimization, which is critical for the correctness of data analysis.
Data aggregation also helps to obtain value from the collection of data. For instance, you can discover the total number of work hours of each employee and detect whether there’s any overtime or underperformance. With data aggregation, you can also calculate customer-related parameters, such as an average purchase amount, satisfaction rate, etc.
Importance of Data Aggregation Tools
Many processes stand behind data aggregation, from collection to analysis. And there is a long way between these two procedures: grouping, transformation, transfer, and other operations on data.
Some tools perform end-to-end aggregation processes, starting from data collection to visualization. However, most data aggregation tools focus either on data ingestion and preparation or analysis and visualization.
Data aggregation tools are important because they can automate data collection from scattered sources. Then, you can blend and group data, apply aggregation functions, create pivot tables, build reports, etc.
Overview of the Top 10 Data Aggregation Tools
1. Skyvia
Skyvia is a universal cloud platform for various data-related tasks. This tool can help with data aggregation, data integration, etc.
Skyvia can collect data from 180+ sources, group and standardize it, and send the refined data to a chosen destination. All the processes can be done via a visual wizard without programming language knowledge.
The following Skyvia’s solutions would be particularly useful for data aggregation:
- Replication tool. This is a visual wizard where you can create ELT pipelines. Replication is a fast way to load data into a database or a data warehouse. It copies data from chosen apps and sends it to the preferred database or a data warehouse. You’ll need to create as many replication scenarios as the number of sources from which data is collected.
- Import tool. It’s a visual wizard where you can build ETL and Reverse ETL pipelines. For instance, you can import data from your CRM, ERP, and other business tools to a database or a data warehouse. Import allows you to execute queries for data selection and apply aggregation functions on it. You’ll need to create an import scenario for each point-to-point integration and apply the needed transformations on the copy of source data.
- Data Flow. It allows users to build more complex data pipelines, including several sources, and apply multistage data transformations like lookup and expression. Control Flow is used together with Data Flow to create logic for task execution, perform pre- and post-integration activities, and configure automatic error processing logic.
- Query. It allows users to gather data from the selected sources by using a visual query builder or writing SQL statements. Then, apply aggregation functions to group the obtained data. Skyvia offers add-in for Excel and add-on for Google Sheets, allowing you to query data directly from a spreadsheet.
Key features:
- Source diversity. Extract data from applications, databases, data warehouses, legacy systems, storage services, and flat files.
- Data integration and aggregation. Select data from the preferred cloud source via SQL query builder, and then group it by a certain criteria. Skyvia supports the following aggregation functions: COUNT, AVG, MIN, MAX, and SUM. Then load this data to the destination of your choice.
- Data transformation. Cleanse data and standardize its format to match the destination requirements.
Pricing:
- A free plan is suitable for those who operate <10,000 records per month. It offers one daily data sync between a source and a destination, and standard data transformation options.
- A basic plan is available starting from $79 per month and offers flexibility for the operated data amount.
- A Standard plan is available starting from $159 per month. The overall cost depends on the amount of data processed. This plan includes hourly data synchronization and 50 scheduled integrations per month.
- A Professional plan is available starting from $199 per month. Its price depends on the selected data amount. It offers a 1-minute interval for data synchronization and update, multiplex data transformations, and advanced integration scenarios.
- An Enterprise plan is a tailor-made offer that matches your data needs. Discuss the pricing and requirements with the Skyvia team.
Suitable for:
- Startups
- Small companies
- Medium-sized businesses
- Enterprises
- Corporations
- Non-profit organizations
- Governmental institutions
- Universities
2. Alteryx
Alteryx is an AI platform with an intuitive interface for enterprise analytics. It enables users to aggregate data from around a hundred sources and blend it. Alteryx also has an embedded module for analyzing the aggregated data.
Key features:
- Data aggregation with the Summarize tool. Drag and drop fields to group them and choose the aggregation function (SUM, COUNT, AVG, etc.). The outcomes obtained in the Summarize tool can be used in other tools on the Alteryx platform.
- Data blending. Combine data from several sources together and elaborate on it.
- Data cleaning. Remove extra spaces, delete duplicates, and detect missing values.
- Predictive and spatial analytics. Develop AI and ML-based models for advanced analytics insights.
Pricing:
- Designer Cloud starting from $4,950
- Designer Desktop starting from $5,195
A 30-day trial is available.
Suitable for:
- Enterprises
3. Talend
Talend offers a platform for data collection, integration, aggregation, management, and governance. It’s adaptable for various data architectures due to its connectivity with a wide range of sources and notable data cleansing capabilities.
Key features:
- SQL templates. Use system SQL templates or create custom ones to streamline data querying. For instance, the Aggregate template already contains statements for data aggregation.
- Visual job builder. Compose data pipelines with drag-and-drop components in the visual builder.
- Data preparation. Standardize the aggregated data with available transformation options.
Pricing:
Talend Data Fabric can be deployed in the cloud, on-premises, or hybrid cloud environments. It’s a customizable solution, so it could be set up in accordance with the specific organizational needs. Subsequently, the price is discussed with the Talend team representatives. It depends on the deployment method and the set of requested features.
A free trial is available.
Suitable for:
- Enterprises
4. Domo
Domo is a platform for data aggregation that powers up business intelligence and data analytics. It pulls data from various sources, blends it, applies cleansing and transformation functions, and centralizes it in a unified dataset. The aggregated data can be used for building custom business apps for data presentation and workflow automation.
Key features:
- Extended connectivity. Domo has 1000+ pre-built connectors for the on-premises services, databases, data warehouses, and cloud apps.
- Data blending. Combine and transform the aggregated data with commands and statements.
- Visualize data. Select the preferred visuals from a set of charts and maps to explore and analyze data.
- Mobile app support. Use an iOS or Android Domo app to view data and create reports.
Pricing:
The cost is defined individually for each Domo customer and depends on data storage, data update rates, number of queries, and users.
A 30-day free trial is available.
Suitable for:
- Small businesses
- Medium-sized companies
- Enterprises
5. Looker Studio
Looker Studio, formerly known as Google Data Studio, is an online tool for data exploration and visualization. It allows users to create dashboards and reports quickly and conveniently. Looker Studio natively connects to 21 sources and more than 985 partner connectors for multiple online services.
Key features:
- Data blending and aggregation. The Blend Editor enables users to join tables visually instead of writing SQL statements.
- User-friendly interface. Looker Studio’s interface is very simple and understandable, allowing even non-tech users to elaborate on datasets.
- A wide availability of dashboard templates. There are many dashboard templates for Looker Studio on the web available for free. You can select the preferred one, aggregate data from necessary sources, and explore it. Such templates are available for practically any department and industry.
Pricing:
Looker Studio is completely free to use for those who have a Google account.
Suitable for:
- Small businesses
- Medium-sized businesses
6. Tableau
Tableau is a powerful business intelligence and data visualization platform. It can connect to around 100 sources, including databases and cloud apps, and get data from files (CSV, JSON, PDF, etc.). Then, you can prepare the aggregated data in Tableau and start exploring it with built-in visualizations.
Key features:
- Data aggregation. Tableau offers a range of aggregation functions (SUM, AVG, MAX, MIN, COUNT, MEDIUM, VARIANCE, etc.)
- Revision history. Revert up to 25 last versions of the selected dataset.
- Querying data with plain language. The Ask Data feature allows users to get answers based on the given data by asking questions without any specific knowledge of programming languages.
- Mobile support. Access data and share insights using a mobile app.
Pricing:
- Tableau Viewer for viewing and interacting with dashboards at $15 per user per month.
- Tableau Explorer for exploring data with self-service analytics at $42 per user per month.
- Tableau Creator for end-to-end analytics workflow at $75 per user per month.
Suitable for:
- Startups
- Small and medium-sized businesses
- Enterprises
- Non-profit organizations
- Government organizations
7. Power BI
Microsoft Power BI is a widely used tool for business intelligence and analytics. It allows you to manually aggregate data by uploading it from separate files or connecting to databases and online sources. As aggregation reduces data complexity, it becomes simpler to visualize and analyze it.
Key features:
- Data cleaning and preprocessing. Identifying duplicates, incorrect values, or incomplete records that can deteriorate the quality of analysis.
- Data grouping. Group data by specific dimensions and apply the aggregation function (MIN, MAX, COUNT, AVG, SUM) via the Power Query Editor.
- DAX. Perform calculations and queries on data with DAX formula expression language, which is similar to SQL.
- Copilot. Ask data-related questions in plain language and get AI-generated answers to them.
Pricing:
- Power BI Pro: $10 per user per month
- Power BI Premium: $20 per user per month
Suitable for:
- Startups
- Small and medium-sized businesses
- Enterprises
- Non-profit organizations
- Government organizations
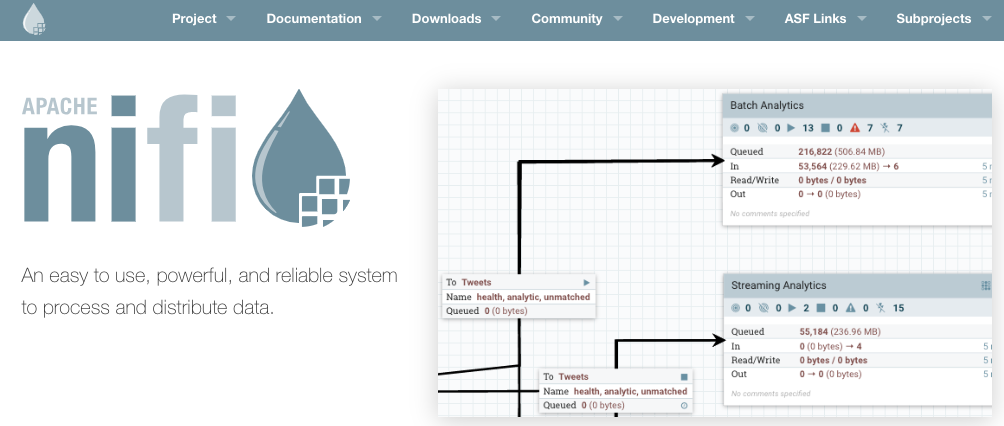
8. Apache NiFi
Apache NiFi is a data flow management system that can handle batches and real-time data streams. It collects, routes, aggregates, transforms, and processes data in a reliable and scalable manner.
Key features:
- Data availability acceleration. Apache NiFi is a catalyst for big data project execution.
- Integration with big data tools. NiFi easily connects to Apache Spark, Apache Kafka, Hadoop, Hive, MongoDB, Cassandra, etc., and collects and aggregates data from them.
Pricing:
Apache NiFi is an open-source solution, so it’s free to use. However, considerable investment is required for the deployment of the necessary underlying hardware resources.
Suitable for:
- Enterprises
- Companies dealing with big data
9. Segment
Segment is a Customer Data Platform (CDP) that simplifies the aggregation of user data from various channels. This tool also transforms, transfers, and archives your first-party customer data. Overall, Segment helps to activate customer data for ad personalization, purchase predictions, and improvement of other marketing activities.
Key features:
- Source function. Collect and aggregate data from third-party applications.
- Transformation function. Fix bad data or standardize it to make it suitable for further processing.
Pricing:
- A Free plan with up to 500,000 Reverse ETL records and two sources.
- A Team plan starts at $120 per month with up to 1,000,000 Reverse ETL records and unlimited sources.
- A Business plan with advanced features and personalized volume at custom pricing.
Suitable for:
- Startups
- Small businesses
- Medium-sized businesses
- Enterprises
10. Fivetran
Fivetran is an automated data movement platform for quick extraction of data from 160+ data connectors. To blend and transform the aggregated data within Fivetran, you’ll need to apply SQL statements.
Key features:
- Real-time data movement. Fivetran supports real-time data replication, creating a solid base for the timely collection and aggregation of the most recent data.
- Data lake management. Aggregate cleansed and standardized data in a data lake.
Pricing:
Fivetran is available under the free plan with up to 500,000 monthly active rows (MAR). The prices of other plans depend on the data amount, number of users, sync interval, advanced security features, and other factors.
Suitable for:
- Startups
- Small businesses
- Medium-sized businesses
- Enterprises
Comparison of the Data Aggregation Tools
Most of the above-mentioned data aggregation tools provide a possibility to create data flows visually. This greatly simplifies and streamlines daily work of data engineers, data analysts, and data scientists.
Other factors may also impact data aggregation processes. Some of the crucial ones are mentioned in the table below.
| Tool | Connectors | Pricing | G2 reviews |
|---|---|---|---|
| Skyvia | 180+ | starting from $0 | 4.8 out of 5 |
| Alteryx | 100+ | starting from $4,950 | 4.6 out of 5 |
| Talend | 140+ | custom pricing | 4.0 out of 5 |
| Domo | 1000+ | custom pricing | 4.4 out of 5 |
| Google Data Studio | 1000+ | custom pricing | 4.4 out of 5 |
| Tableau | 100+ | starting from $15 | 4.4 out of 5 |
| Power BI | 150+ | starting from $10 | 4.5 out of 5 |
| Apache NiFi | custom code for adding connectors | free | 4.2 out of 5 |
| Segment | 450+ | starting from $0 | 4.5 out of 5 |
| Fivetran | 160+ | starting from $0 | 4.2 out of 5 |
For more details, you can also review a detailed comparison of data aggregation tools:
- Skyvia vs Alteryx
- Skyvia vs Talend
- Skyvia vs Fivetran
- Skyvia vs Apache NiFi
- Fivetran vs Talend
- Fivetran vs Alteryx
- Fivetran vs Apache NiFi
- Talend vs Apache NiFi
- Talend vs Alteryx
Criteria for Selecting Data Aggregation Tools
Each business has its own expectations regarding the aggregation of data. Based on these expectations, the requirements for the data aggregation tool selection are formed.
While price is usually the most significant criterion when selecting any tool for business operations, you should consider this parameter first. If several suitable options match your budget, pay attention to the supported connectors and make sure there are sources from which you want to collect data. Also, check whether the selected solution is convenient to use and see what other users think about it.
Skyvia can be a win-win for your business because it satisfies all of the above-mentioned criteria. It offers pricing plans matching various budgets and data aggregation needs. Moreover, it allows you to collect data from more than 190 cloud apps, databases, and data warehouses. Skyvia is one of the top of the most user-friendly tools, and users rate its overall functionality at 4.8 on G2.
Final Thoughts
Data aggregation tools automate data collection from apps, databases, legacy systems, and other sources. They also summarize the grouped data quickly, revealing more insights about employees, customers, and overall business performance.
Selecting the data aggregation tool that best suits your business requirements largely contributes to the value extraction from data.